29
/
en
AIzaSyAYiBZKx7MnpbEhh9jyipgxe19OcubqV5w
April 1, 2024
278259
Uruguay
URY
true
2
1
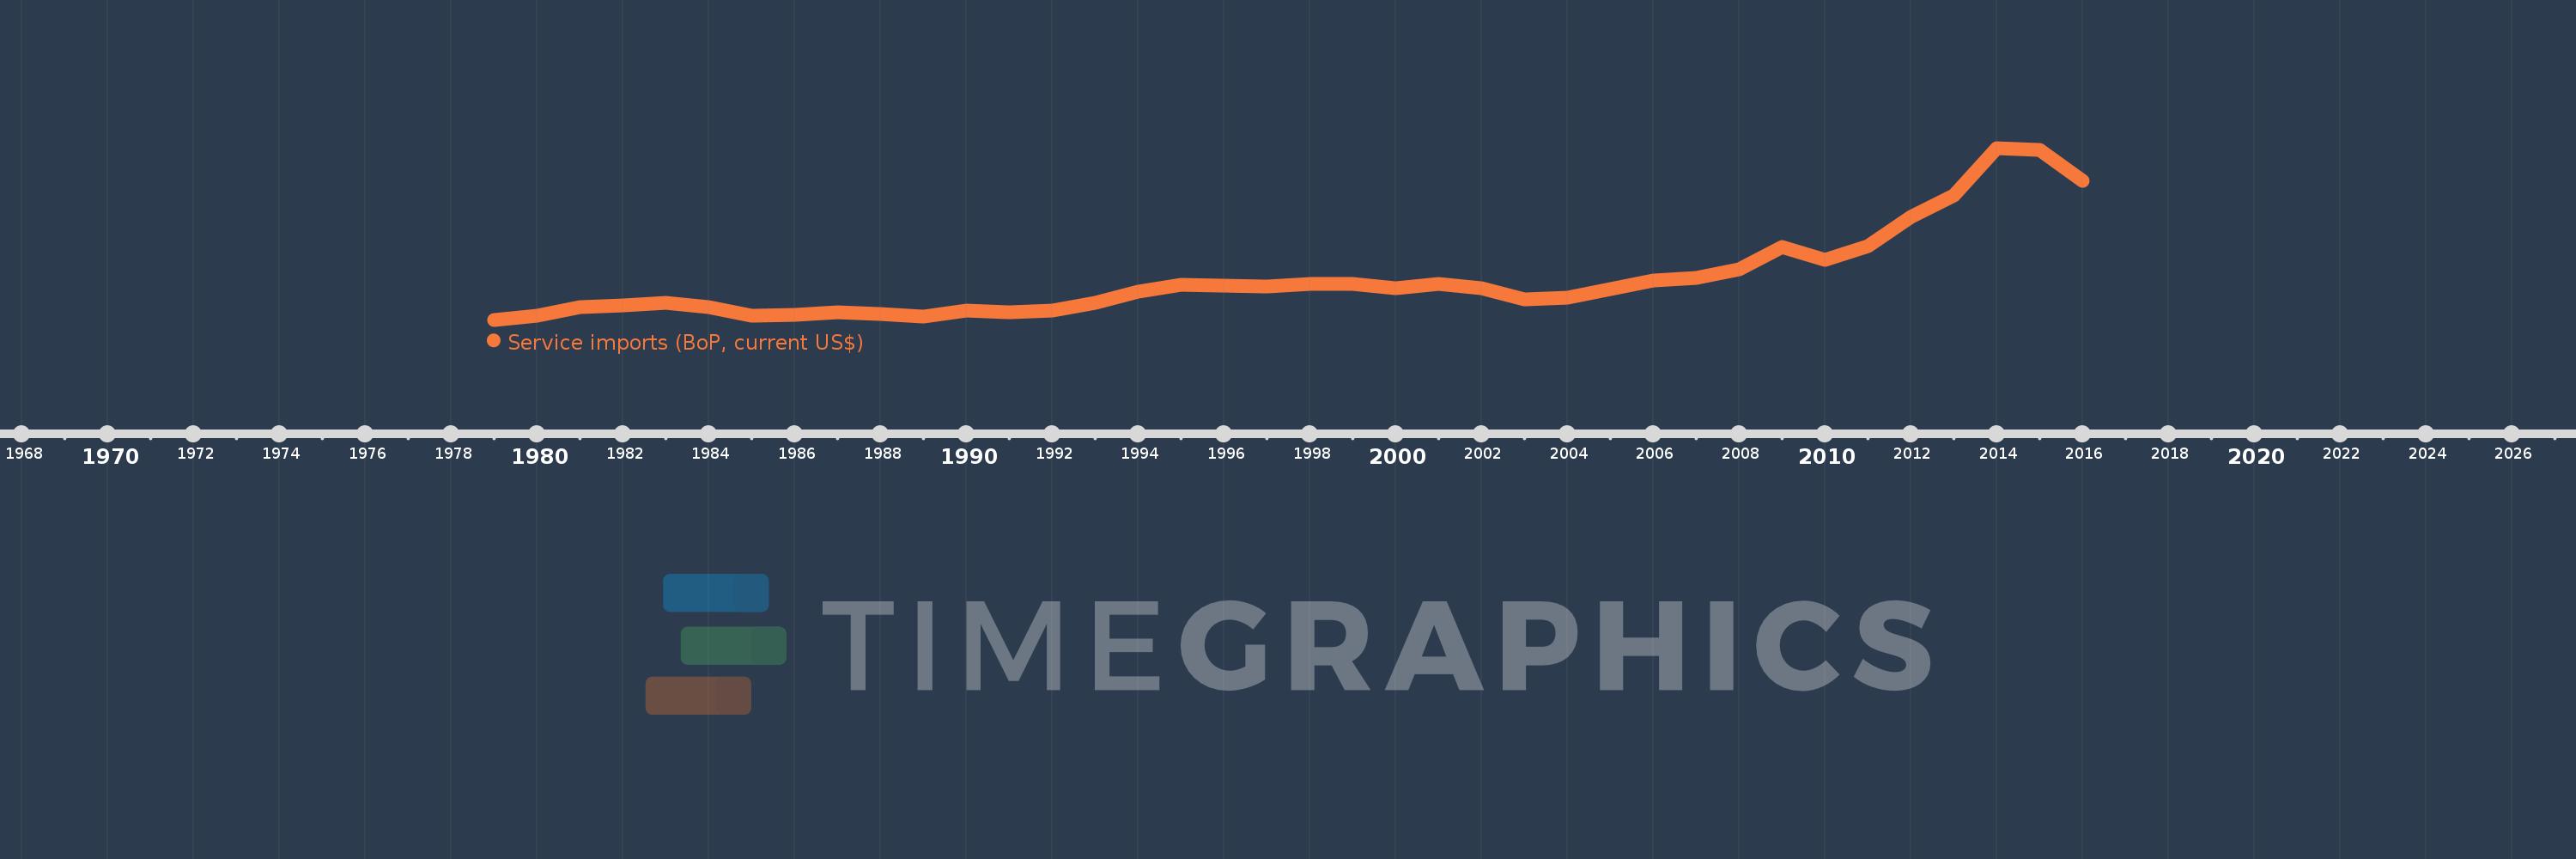
Service imports (BoP, current US$)
2016,2015,2014,2013,2012,2011,2010,2009,2008,2007,2006,2005,2004,2003,2002,2001,2000,1999,1998,1997,1996,1995,1994,1993,1992,1991,1990,1989,1988,1987,1986,1985,1984,1983,1982,1981,1980,1979
This statistics in other country:
AfghanistanAlbaniaAlgeriaAngolaAntigua and BarbudaArab WorldArgentinaArmeniaArubaAustraliaAustriaAzerbaijanBahamas, TheBahrainBangladeshBarbadosBelarusBelgiumBelizeBeninBermudaBhutanBoliviaBosnia and HerzegovinaBotswanaBrazilBrunei DarussalamBulgariaBurkina FasoBurundiCabo VerdeCambodiaCameroonCanadaCaribbean small statesCentral African RepublicCentral Europe and the BalticsChadChileChinaColombiaComorosCongo, Dem. Rep.Congo, Rep.Costa RicaCote d'IvoireCroatiaCuracaoCyprusCzech RepublicDenmarkDjiboutiDominicaDominican RepublicEarly-demographic dividendEast Asia & PacificEast Asia & Pacific (excluding high income)East Asia & Pacific (IDA & IBRD countries)EcuadorEgypt, Arab Rep.El SalvadorEquatorial GuineaEritreaEstoniaEthiopiaEuro areaEurope & Central AsiaEurope & Central Asia (excluding high income)Europe & Central Asia (IDA & IBRD countries)European UnionFaroe IslandsFijiFinlandFragile and conflict affected situationsFranceFrench PolynesiaGabonGambia, TheGeorgiaGermanyGhanaGreeceGrenadaGuatemalaGuineaGuinea-BissauGuyanaHaitiHeavily indebted poor countries (HIPC)High incomeHondurasHong Kong SAR, ChinaHungaryIBRD onlyIcelandIDA & IBRD totalIDA blendIDA onlyIDA totalIndiaIndonesiaIran, Islamic Rep.IraqIrelandIsraelItalyJamaicaJapanJordanKazakhstanKenyaKiribatiKorea, Rep.KosovoKuwaitKyrgyz RepublicLao PDRLate-demographic dividendLatin America & Caribbean Latin America & Caribbean (excluding high income)Latin America & the Caribbean (IDA & IBRD countries)LatviaLeast developed countries: UN classificationLebanonLesothoLiberiaLibyaLithuaniaLow & middle incomeLow incomeLower middle incomeLuxembourgMacao SAR, ChinaMacedonia, FYRMadagascarMalawiMalaysiaMaldivesMaliMaltaMarshall IslandsMauritaniaMauritiusMexicoMicronesia, Fed. Sts.Middle East & North Africa (excluding high income)Middle East & North Africa (IDA & IBRD countries)Middle incomeMoldovaMongoliaMontenegroMoroccoMozambiqueMyanmarNamibiaNepalNetherlandsNew CaledoniaNew ZealandNicaraguaNigerNigeriaNorth AmericaNorwayOECD membersOmanOther small statesPacific island small statesPakistanPalauPanamaPapua New GuineaParaguayPeruPhilippinesPolandPortugalPost-demographic dividendPre-demographic dividendQatarRomaniaRussian FederationRwandaSamoaSao Tome and PrincipeSaudi ArabiaSenegalSerbiaSeychellesSierra LeoneSingaporeSint Maarten (Dutch part)Slovak RepublicSloveniaSmall statesSolomon IslandsSouth AfricaSouth AsiaSouth Asia (IDA & IBRD)South SudanSpainSri LankaSt. Kitts and NevisSt. LuciaSt. Vincent and the GrenadinesSub-Saharan Africa Sub-Saharan Africa (excluding high income)Sub-Saharan Africa (IDA & IBRD countries)SudanSurinameSwazilandSwedenSwitzerlandSyrian Arab RepublicTajikistanTanzaniaThailandTimor-LesteTogoTongaTrinidad and TobagoTunisiaTurkeyTuvaluUgandaUkraineUnited KingdomUnited StatesUpper middle incomeUruguayVanuatuVenezuela, RBVietnamWest Bank and GazaWorldYemen, Rep.ZambiaZimbabwe Timeline:
This timeline shows a graph from 1979 to 2016 of Uruguay. No data until 1978. Number of actual observations by date: 38.
Source name:
World Development Indicators
Source organization:
International Monetary Fund, Balance of Payments Statistics Yearbook and data files.
Categories, topics:
Economy & Growth, Trade
Last updated:
apr 23, 2017
Indicators value changes by year
Minimum:
260.4 mln
jan 1, 1979
Maximum:
3.24 bln
jan 1, 2014
At the date of observation
Value
Absolute change
Change from previous value
jan 1, 1979
260.4 mln
+260.4 mln
0.0%
jan 1, 1980
337.3 mln
+76.9 mln
29.53%
jan 1, 1981
475.5 mln
+138.2 mln
40.97%
jan 1, 1982
505.9 mln
+30.4 mln
6.39%
jan 1, 1983
547.1 mln
+41.2 mln
8.14%
jan 1, 1984
472.5 mln
-74.6 mln
-13.64%
jan 1, 1985
334.7 mln
-137.8 mln
-29.16%
jan 1, 1986
339.6 mln
+4.9 mln
1.46%
jan 1, 1987
387.14 mln
+47.54 mln
14.0%
jan 1, 1988
356.26 mln
-30.88 mln
-7.98%
jan 1, 1989
315.43 mln
-40.83 mln
-11.46%
jan 1, 1990
421.72 mln
+106.29 mln
33.7%
jan 1, 1991
392.5 mln
-29.22 mln
-6.93%
jan 1, 1992
422.49 mln
+29.99 mln
7.64%
jan 1, 1993
558.82 mln
+136.33 mln
32.27%
jan 1, 1994
746.45 mln
+187.63 mln
33.58%
jan 1, 1995
861.6 mln
+115.15 mln
15.43%
jan 1, 1996
857.7 mln
-3.9 mln
-0.45%
jan 1, 1997
839.0 mln
-18.7 mln
-2.18%
jan 1, 1998
888.6 mln
+49.6 mln
5.91%
jan 1, 1999
883.6 mln
-5.0 mln
-0.56%
jan 1, 2000
802.3 mln
-81.3 mln
-9.2%
jan 1, 2001
881.586 mln
+79.286 mln
9.88%
jan 1, 2002
806.707 mln
-74.879 mln
-8.49%
jan 1, 2003
618.051 mln
-188.657 mln
-23.39%
jan 1, 2004
636.297 mln
+18.246 mln
2.95%
jan 1, 2005
786.076 mln
+149.779 mln
23.54%
jan 1, 2006
939.478 mln
+153.403 mln
19.51%
jan 1, 2007
978.679 mln
+39.201 mln
4.17%
jan 1, 2008
1.13 bln
+151.33 mln
15.46%
jan 1, 2009
1.523 bln
+393.326 mln
34.81%
jan 1, 2010
1.295 bln
-228.454 mln
-15.0%
jan 1, 2011
1.531 bln
+236.043 mln
18.23%
jan 1, 2012
2.05 bln
+519.329 mln
33.92%
jan 1, 2013
2.411 bln
+361.233 mln
17.62%
jan 1, 2014
3.24 bln
+828.563 mln
34.36%
jan 1, 2015
3.203 bln
-37.246 mln
-1.15%
jan 1, 2016
2.669 bln
-533.402 mln
-16.65%
Ranking of countries by current statistics by years


Comments: