29
/
en
AIzaSyAYiBZKx7MnpbEhh9jyipgxe19OcubqV5w
April 1, 2024
286588
Zambia
ZMB
true
2
1
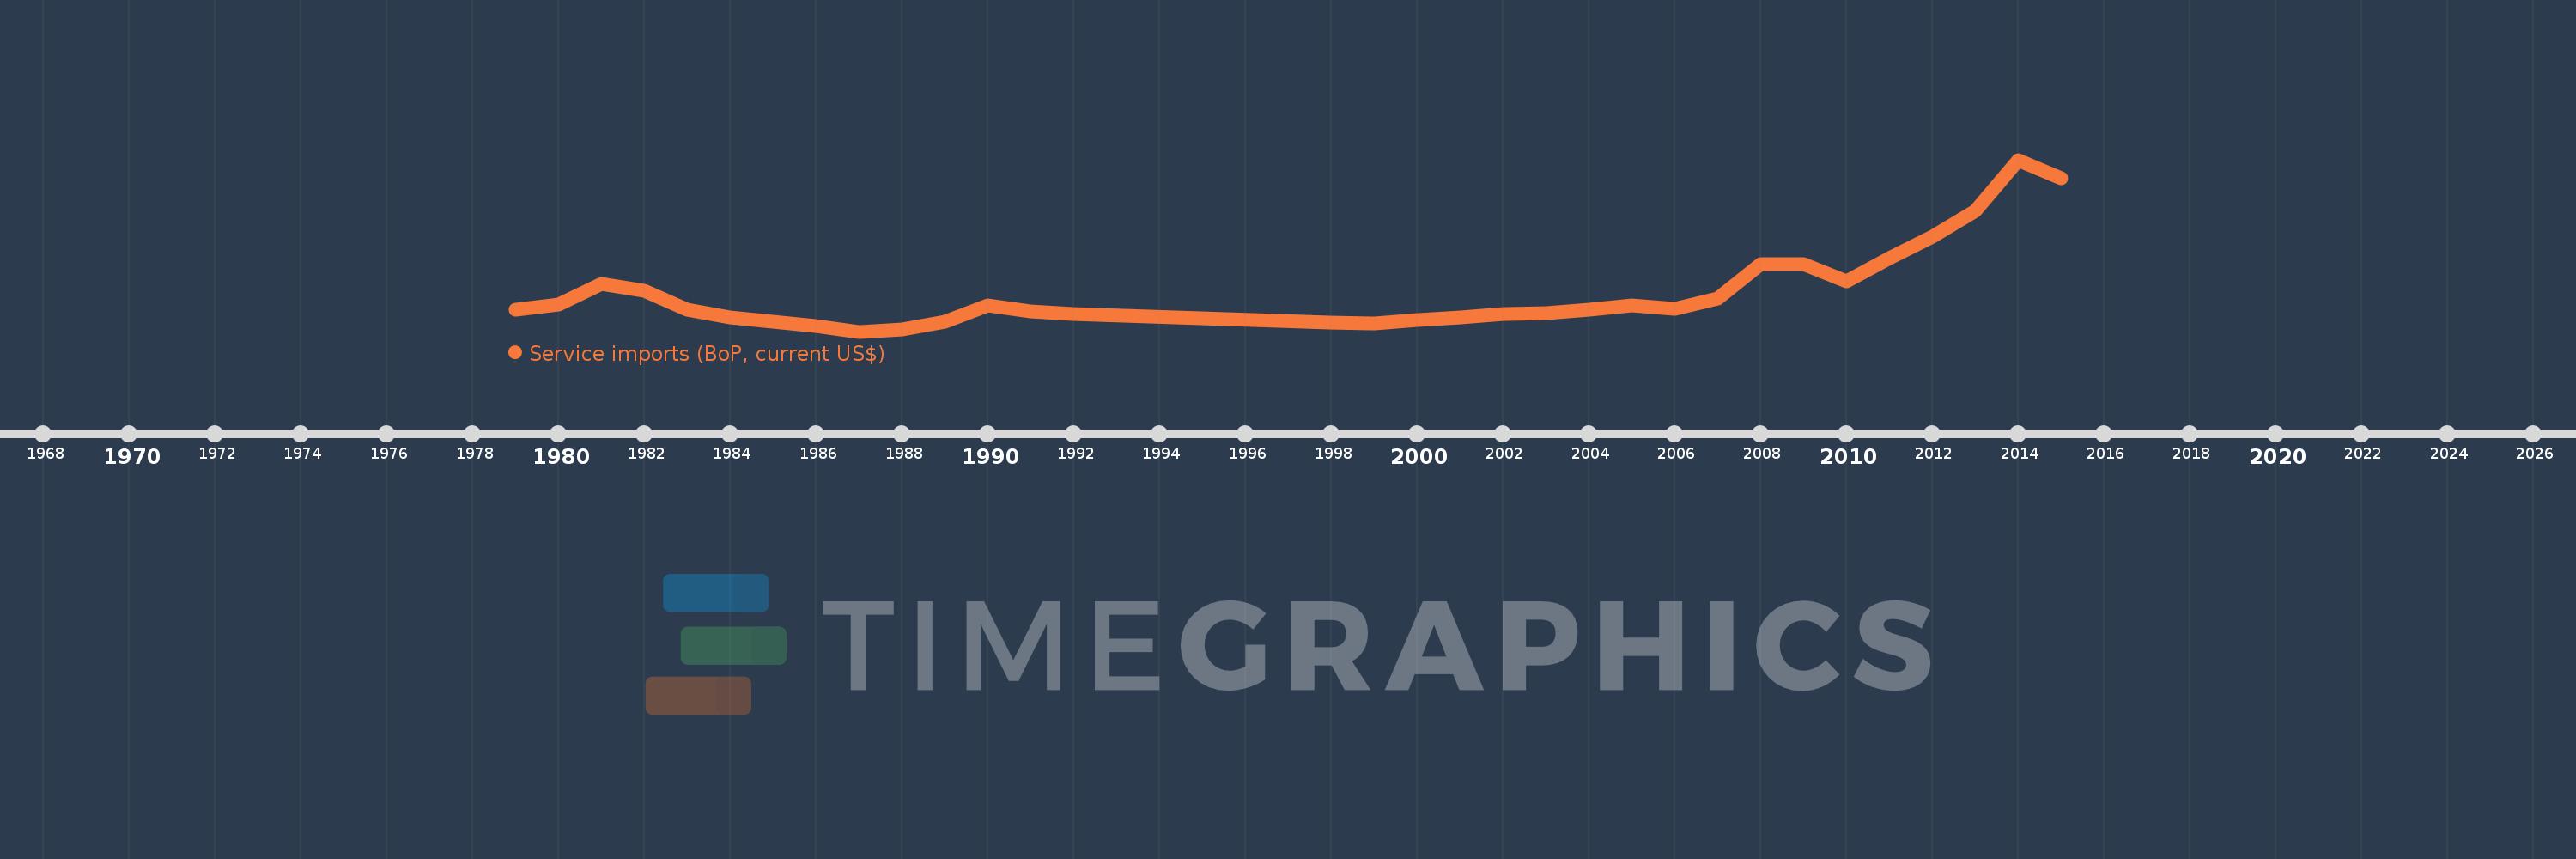
Service imports (BoP, current US$)
2015,2014,2013,2012,2011,2010,2009,2008,2007,2006,2005,2004,2003,2002,2001,2000,1999,1998,1992,1991,1990,1989,1988,1987,1986,1985,1984,1983,1982,1981,1980,1979
This statistics in other country:
AfghanistanAlbaniaAlgeriaAngolaAntigua and BarbudaArab WorldArgentinaArmeniaArubaAustraliaAustriaAzerbaijanBahamas, TheBahrainBangladeshBarbadosBelarusBelgiumBelizeBeninBermudaBhutanBoliviaBosnia and HerzegovinaBotswanaBrazilBrunei DarussalamBulgariaBurkina FasoBurundiCabo VerdeCambodiaCameroonCanadaCaribbean small statesCentral African RepublicCentral Europe and the BalticsChadChileChinaColombiaComorosCongo, Dem. Rep.Congo, Rep.Costa RicaCote d'IvoireCroatiaCuracaoCyprusCzech RepublicDenmarkDjiboutiDominicaDominican RepublicEarly-demographic dividendEast Asia & PacificEast Asia & Pacific (excluding high income)East Asia & Pacific (IDA & IBRD countries)EcuadorEgypt, Arab Rep.El SalvadorEquatorial GuineaEritreaEstoniaEthiopiaEuro areaEurope & Central AsiaEurope & Central Asia (excluding high income)Europe & Central Asia (IDA & IBRD countries)European UnionFaroe IslandsFijiFinlandFragile and conflict affected situationsFranceFrench PolynesiaGabonGambia, TheGeorgiaGermanyGhanaGreeceGrenadaGuatemalaGuineaGuinea-BissauGuyanaHaitiHeavily indebted poor countries (HIPC)High incomeHondurasHong Kong SAR, ChinaHungaryIBRD onlyIcelandIDA & IBRD totalIDA blendIDA onlyIDA totalIndiaIndonesiaIran, Islamic Rep.IraqIrelandIsraelItalyJamaicaJapanJordanKazakhstanKenyaKiribatiKorea, Rep.KosovoKuwaitKyrgyz RepublicLao PDRLate-demographic dividendLatin America & Caribbean Latin America & Caribbean (excluding high income)Latin America & the Caribbean (IDA & IBRD countries)LatviaLeast developed countries: UN classificationLebanonLesothoLiberiaLibyaLithuaniaLow & middle incomeLow incomeLower middle incomeLuxembourgMacao SAR, ChinaMacedonia, FYRMadagascarMalawiMalaysiaMaldivesMaliMaltaMarshall IslandsMauritaniaMauritiusMexicoMicronesia, Fed. Sts.Middle East & North Africa (excluding high income)Middle East & North Africa (IDA & IBRD countries)Middle incomeMoldovaMongoliaMontenegroMoroccoMozambiqueMyanmarNamibiaNepalNetherlandsNew CaledoniaNew ZealandNicaraguaNigerNigeriaNorth AmericaNorwayOECD membersOmanOther small statesPacific island small statesPakistanPalauPanamaPapua New GuineaParaguayPeruPhilippinesPolandPortugalPost-demographic dividendPre-demographic dividendQatarRomaniaRussian FederationRwandaSamoaSao Tome and PrincipeSaudi ArabiaSenegalSerbiaSeychellesSierra LeoneSingaporeSint Maarten (Dutch part)Slovak RepublicSloveniaSmall statesSolomon IslandsSouth AfricaSouth AsiaSouth Asia (IDA & IBRD)South SudanSpainSri LankaSt. Kitts and NevisSt. LuciaSt. Vincent and the GrenadinesSub-Saharan Africa Sub-Saharan Africa (excluding high income)Sub-Saharan Africa (IDA & IBRD countries)SudanSurinameSwazilandSwedenSwitzerlandSyrian Arab RepublicTajikistanTanzaniaThailandTimor-LesteTogoTongaTrinidad and TobagoTunisiaTurkeyTuvaluUgandaUkraineUnited KingdomUnited StatesUpper middle incomeUruguayVanuatuVenezuela, RBVietnamWest Bank and GazaWorldYemen, Rep.ZambiaZimbabwe Timeline:
This timeline shows a graph from 1979 to 2015 of Zambia. No data until 1978. Number of actual observations by date: 32.
Source name:
World Development Indicators
Source organization:
International Monetary Fund, Balance of Payments Statistics Yearbook and data files.
Categories, topics:
Economy & Growth, Trade
Last updated:
apr 23, 2017
Indicators value changes by year
Minimum:
198.8 mln
jan 1, 1987
Maximum:
1.816 bln
jan 1, 2014
At the date of observation
Value
Absolute change
Change from previous value
jan 1, 1979
407.6 mln
+407.6 mln
0.0%
jan 1, 1980
456.0 mln
+48.4 mln
11.87%
jan 1, 1981
651.1 mln
+195.1 mln
42.79%
jan 1, 1982
584.5 mln
-66.6 mln
-10.23%
jan 1, 1983
408.6 mln
-175.9 mln
-30.09%
jan 1, 1984
334.0 mln
-74.6 mln
-18.26%
jan 1, 1985
290.5 mln
-43.5 mln
-13.02%
jan 1, 1986
254.5 mln
-36.0 mln
-12.39%
jan 1, 1987
198.8 mln
-55.7 mln
-21.89%
jan 1, 1988
223.0 mln
+24.2 mln
12.17%
jan 1, 1989
289.1 mln
+66.1 mln
29.64%
jan 1, 1990
443.9 mln
+154.8 mln
53.55%
jan 1, 1991
386.1 mln
-57.8 mln
-13.02%
jan 1, 1992
362.8 mln
-23.3 mln
-6.03%
jan 1, 1998
281.7 mln
-81.1 mln
-22.35%
jan 1, 1999
278.0 mln
-3.7 mln
-1.31%
jan 1, 2000
305.8 mln
+27.8 mln
10.0%
jan 1, 2001
334.627 mln
+28.827 mln
9.43%
jan 1, 2002
366.627 mln
+32.0 mln
9.56%
jan 1, 2003
374.8 mln
+8.173 mln
2.23%
jan 1, 2004
403.4 mln
+28.6 mln
7.63%
jan 1, 2005
447.3 mln
+43.9 mln
10.88%
jan 1, 2006
412.244 mln
-35.056 mln
-7.84%
jan 1, 2007
514.041 mln
+101.796 mln
24.69%
jan 1, 2008
834.994 mln
+320.953 mln
62.44%
jan 1, 2009
834.727 mln
-267.234K
-0.03%
jan 1, 2010
671.765 mln
-162.962 mln
-19.52%
jan 1, 2011
888.112 mln
+216.346 mln
32.21%
jan 1, 2012
1.093 bln
+204.907 mln
23.07%
jan 1, 2013
1.334 bln
+240.925 mln
22.04%
jan 1, 2014
1.816 bln
+482.293 mln
36.16%
jan 1, 2015
1.644 bln
-171.849 mln
-9.46%
Ranking of countries by current statistics by years


Comments: