29
/
en
AIzaSyAYiBZKx7MnpbEhh9jyipgxe19OcubqV5w
April 1, 2024
165543
Jordan
JOR
true
2
1
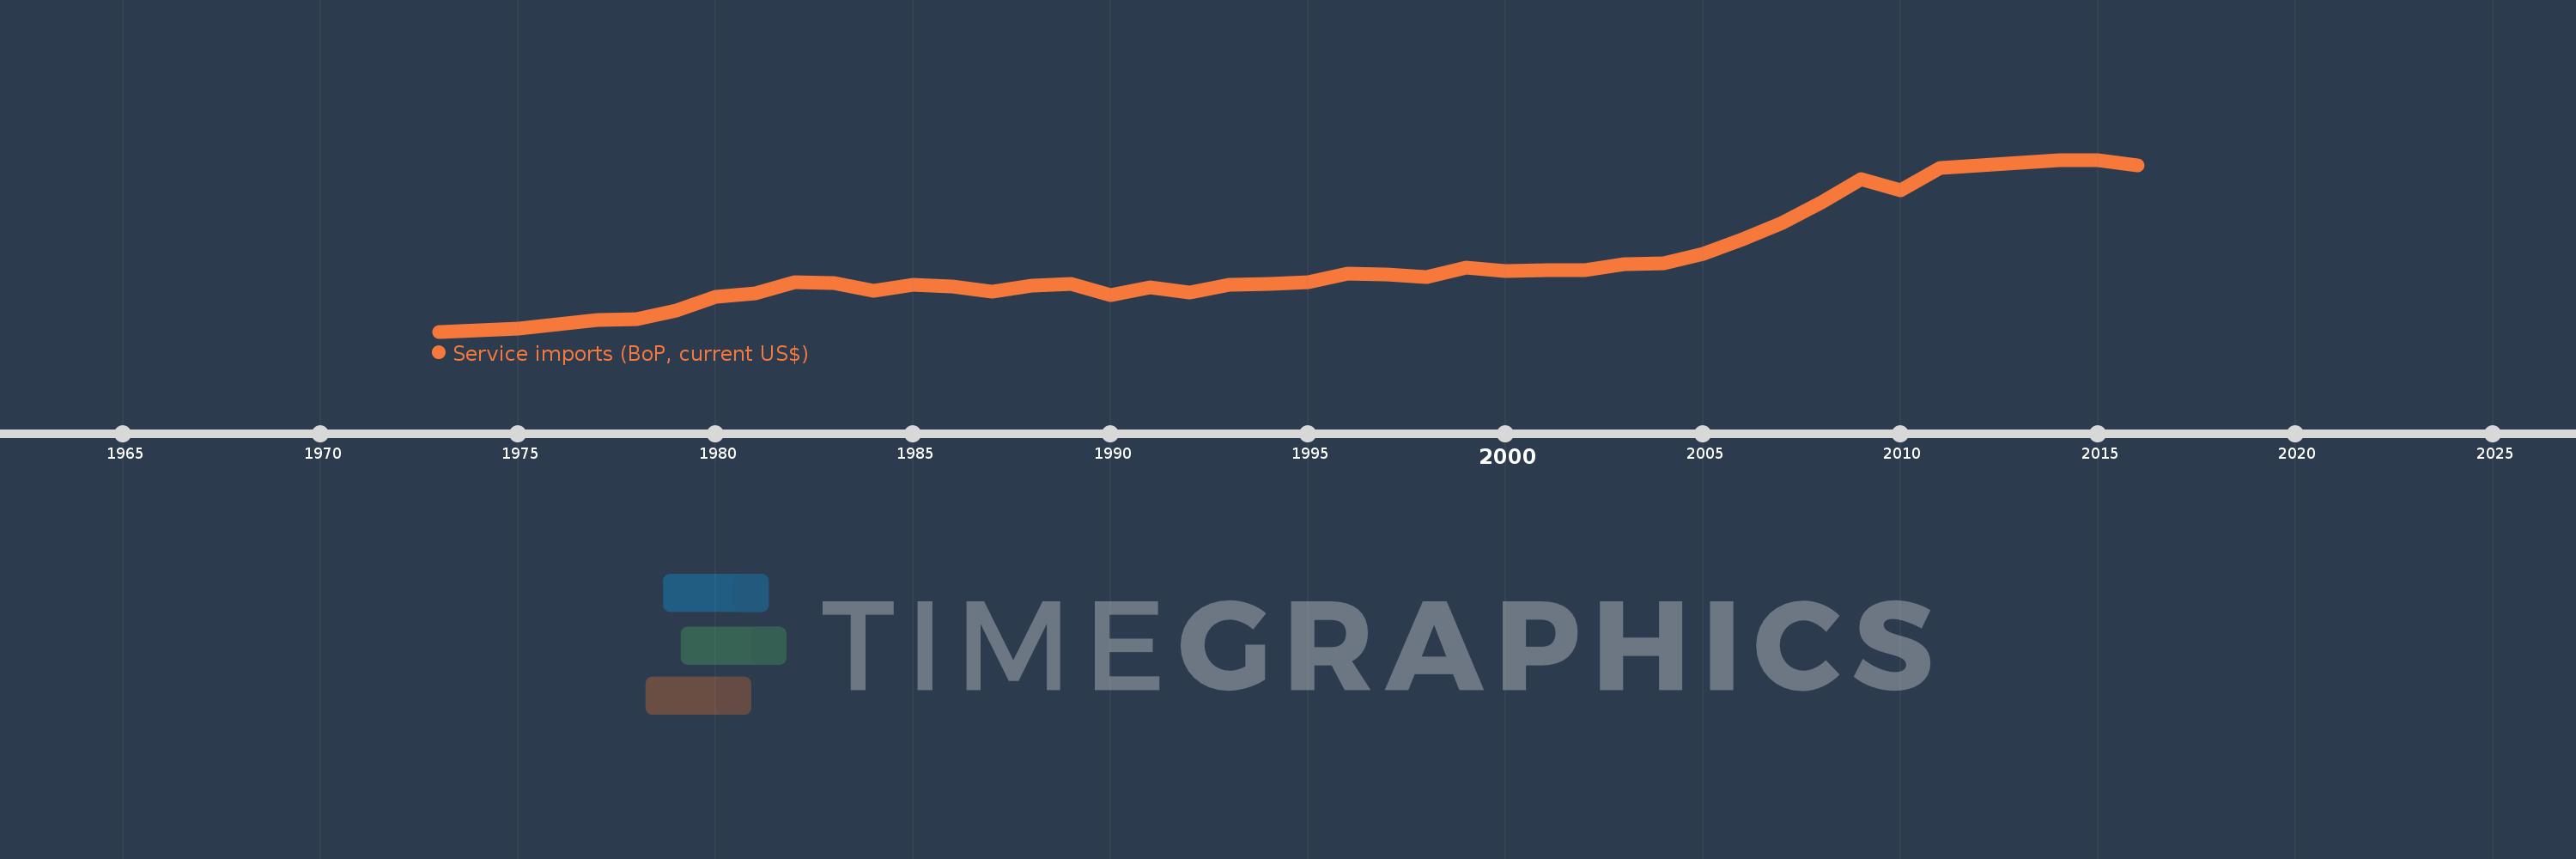
Service imports (BoP, current US$)
2016,2015,2014,2013,2012,2011,2010,2009,2008,2007,2006,2005,2004,2003,2002,2001,2000,1999,1998,1997,1996,1995,1994,1993,1992,1991,1990,1989,1988,1987,1986,1985,1984,1983,1982,1981,1980,1979,1978,1977,1976,1975,1974,1973
This statistics in other country:
AfghanistanAlbaniaAlgeriaAngolaAntigua and BarbudaArab WorldArgentinaArmeniaArubaAustraliaAustriaAzerbaijanBahamas, TheBahrainBangladeshBarbadosBelarusBelgiumBelizeBeninBermudaBhutanBoliviaBosnia and HerzegovinaBotswanaBrazilBrunei DarussalamBulgariaBurkina FasoBurundiCabo VerdeCambodiaCameroonCanadaCaribbean small statesCentral African RepublicCentral Europe and the BalticsChadChileChinaColombiaComorosCongo, Dem. Rep.Congo, Rep.Costa RicaCote d'IvoireCroatiaCuracaoCyprusCzech RepublicDenmarkDjiboutiDominicaDominican RepublicEarly-demographic dividendEast Asia & PacificEast Asia & Pacific (excluding high income)East Asia & Pacific (IDA & IBRD countries)EcuadorEgypt, Arab Rep.El SalvadorEquatorial GuineaEritreaEstoniaEthiopiaEuro areaEurope & Central AsiaEurope & Central Asia (excluding high income)Europe & Central Asia (IDA & IBRD countries)European UnionFaroe IslandsFijiFinlandFragile and conflict affected situationsFranceFrench PolynesiaGabonGambia, TheGeorgiaGermanyGhanaGreeceGrenadaGuatemalaGuineaGuinea-BissauGuyanaHaitiHeavily indebted poor countries (HIPC)High incomeHondurasHong Kong SAR, ChinaHungaryIBRD onlyIcelandIDA & IBRD totalIDA blendIDA onlyIDA totalIndiaIndonesiaIran, Islamic Rep.IraqIrelandIsraelItalyJamaicaJapanJordanKazakhstanKenyaKiribatiKorea, Rep.KosovoKuwaitKyrgyz RepublicLao PDRLate-demographic dividendLatin America & Caribbean Latin America & Caribbean (excluding high income)Latin America & the Caribbean (IDA & IBRD countries)LatviaLeast developed countries: UN classificationLebanonLesothoLiberiaLibyaLithuaniaLow & middle incomeLow incomeLower middle incomeLuxembourgMacao SAR, ChinaMacedonia, FYRMadagascarMalawiMalaysiaMaldivesMaliMaltaMarshall IslandsMauritaniaMauritiusMexicoMicronesia, Fed. Sts.Middle East & North Africa (excluding high income)Middle East & North Africa (IDA & IBRD countries)Middle incomeMoldovaMongoliaMontenegroMoroccoMozambiqueMyanmarNamibiaNepalNetherlandsNew CaledoniaNew ZealandNicaraguaNigerNigeriaNorth AmericaNorwayOECD membersOmanOther small statesPacific island small statesPakistanPalauPanamaPapua New GuineaParaguayPeruPhilippinesPolandPortugalPost-demographic dividendPre-demographic dividendQatarRomaniaRussian FederationRwandaSamoaSao Tome and PrincipeSaudi ArabiaSenegalSerbiaSeychellesSierra LeoneSingaporeSint Maarten (Dutch part)Slovak RepublicSloveniaSmall statesSolomon IslandsSouth AfricaSouth AsiaSouth Asia (IDA & IBRD)South SudanSpainSri LankaSt. Kitts and NevisSt. LuciaSt. Vincent and the GrenadinesSub-Saharan Africa Sub-Saharan Africa (excluding high income)Sub-Saharan Africa (IDA & IBRD countries)SudanSurinameSwazilandSwedenSwitzerlandSyrian Arab RepublicTajikistanTanzaniaThailandTimor-LesteTogoTongaTrinidad and TobagoTunisiaTurkeyTuvaluUgandaUkraineUnited KingdomUnited StatesUpper middle incomeUruguayVanuatuVenezuela, RBVietnamWest Bank and GazaWorldYemen, Rep.ZambiaZimbabwe Timeline:
This timeline shows a graph from 1973 to 2016 of Jordan. No data until 1972. Number of actual observations by date: 44.
Source name:
World Development Indicators
Source organization:
International Monetary Fund, Balance of Payments Statistics Yearbook and data files.
Categories, topics:
Economy & Growth, Trade
Last updated:
apr 23, 2017
Indicators value changes by year
Minimum:
90.72 mln
jan 1, 1973
Maximum:
4.634 bln
jan 1, 2015
At the date of observation
Value
Absolute change
Change from previous value
jan 1, 1973
90.72 mln
+90.72 mln
0.0%
jan 1, 1974
122.044 mln
+31.324 mln
34.53%
jan 1, 1975
172.311 mln
+50.268 mln
41.19%
jan 1, 1976
293.316 mln
+121.005 mln
70.22%
jan 1, 1977
387.369 mln
+94.053 mln
32.07%
jan 1, 1978
425.958 mln
+38.589 mln
9.96%
jan 1, 1979
650.51 mln
+224.552 mln
52.72%
jan 1, 1980
1.002 bln
+351.154 mln
53.98%
jan 1, 1981
1.094 bln
+92.679 mln
9.25%
jan 1, 1982
1.386 bln
+291.778 mln
26.66%
jan 1, 1983
1.377 bln
-9.253 mln
-0.67%
jan 1, 1984
1.159 bln
-217.402 mln
-15.79%
jan 1, 1985
1.33 bln
+170.763 mln
14.73%
jan 1, 1986
1.287 bln
-43.3 mln
-3.26%
jan 1, 1987
1.15 bln
-136.432 mln
-10.6%
jan 1, 1988
1.298 bln
+147.806 mln
12.85%
jan 1, 1989
1.34 bln
+42.175 mln
3.25%
jan 1, 1990
1.063 bln
-277.209 mln
-20.68%
jan 1, 1991
1.268 bln
+204.582 mln
19.24%
jan 1, 1992
1.122 bln
-145.354 mln
-11.46%
jan 1, 1993
1.325 bln
+202.218 mln
18.01%
jan 1, 1994
1.347 bln
+22.438 mln
1.69%
jan 1, 1995
1.393 bln
+45.557 mln
3.38%
jan 1, 1996
1.615 bln
+222.226 mln
15.96%
jan 1, 1997
1.598 bln
-17.192 mln
-1.06%
jan 1, 1998
1.537 bln
-60.508 mln
-3.79%
jan 1, 1999
1.784 bln
+246.544 mln
16.04%
jan 1, 2000
1.698 bln
-85.755 mln
-4.81%
jan 1, 2001
1.722 bln
+23.977 mln
1.41%
jan 1, 2002
1.726 bln
+3.852 mln
0.22%
jan 1, 2003
1.883 bln
+157.079 mln
9.1%
jan 1, 2004
1.889 bln
+6.347 mln
0.34%
jan 1, 2005
2.146 bln
+256.559 mln
13.58%
jan 1, 2006
2.542 bln
+396.192 mln
18.46%
jan 1, 2007
2.971 bln
+428.632 mln
16.86%
jan 1, 2008
3.517 bln
+546.687 mln
18.4%
jan 1, 2009
4.127 bln
+609.185 mln
17.32%
jan 1, 2010
3.818 bln
-308.929 mln
-7.49%
jan 1, 2011
4.419 bln
+601.408 mln
15.75%
jan 1, 2012
4.475 bln
+56.479 mln
1.28%
jan 1, 2013
4.544 bln
+68.873 mln
1.54%
jan 1, 2014
4.612 bln
+67.183 mln
1.48%
jan 1, 2015
4.634 bln
+22.535 mln
0.49%
jan 1, 2016
4.496 bln
-138.169 mln
-2.98%
Ranking of countries by current statistics by years


Comments: