29
/
en
AIzaSyAYiBZKx7MnpbEhh9jyipgxe19OcubqV5w
April 1, 2024
119388
Denmark
DNK
true
2
1
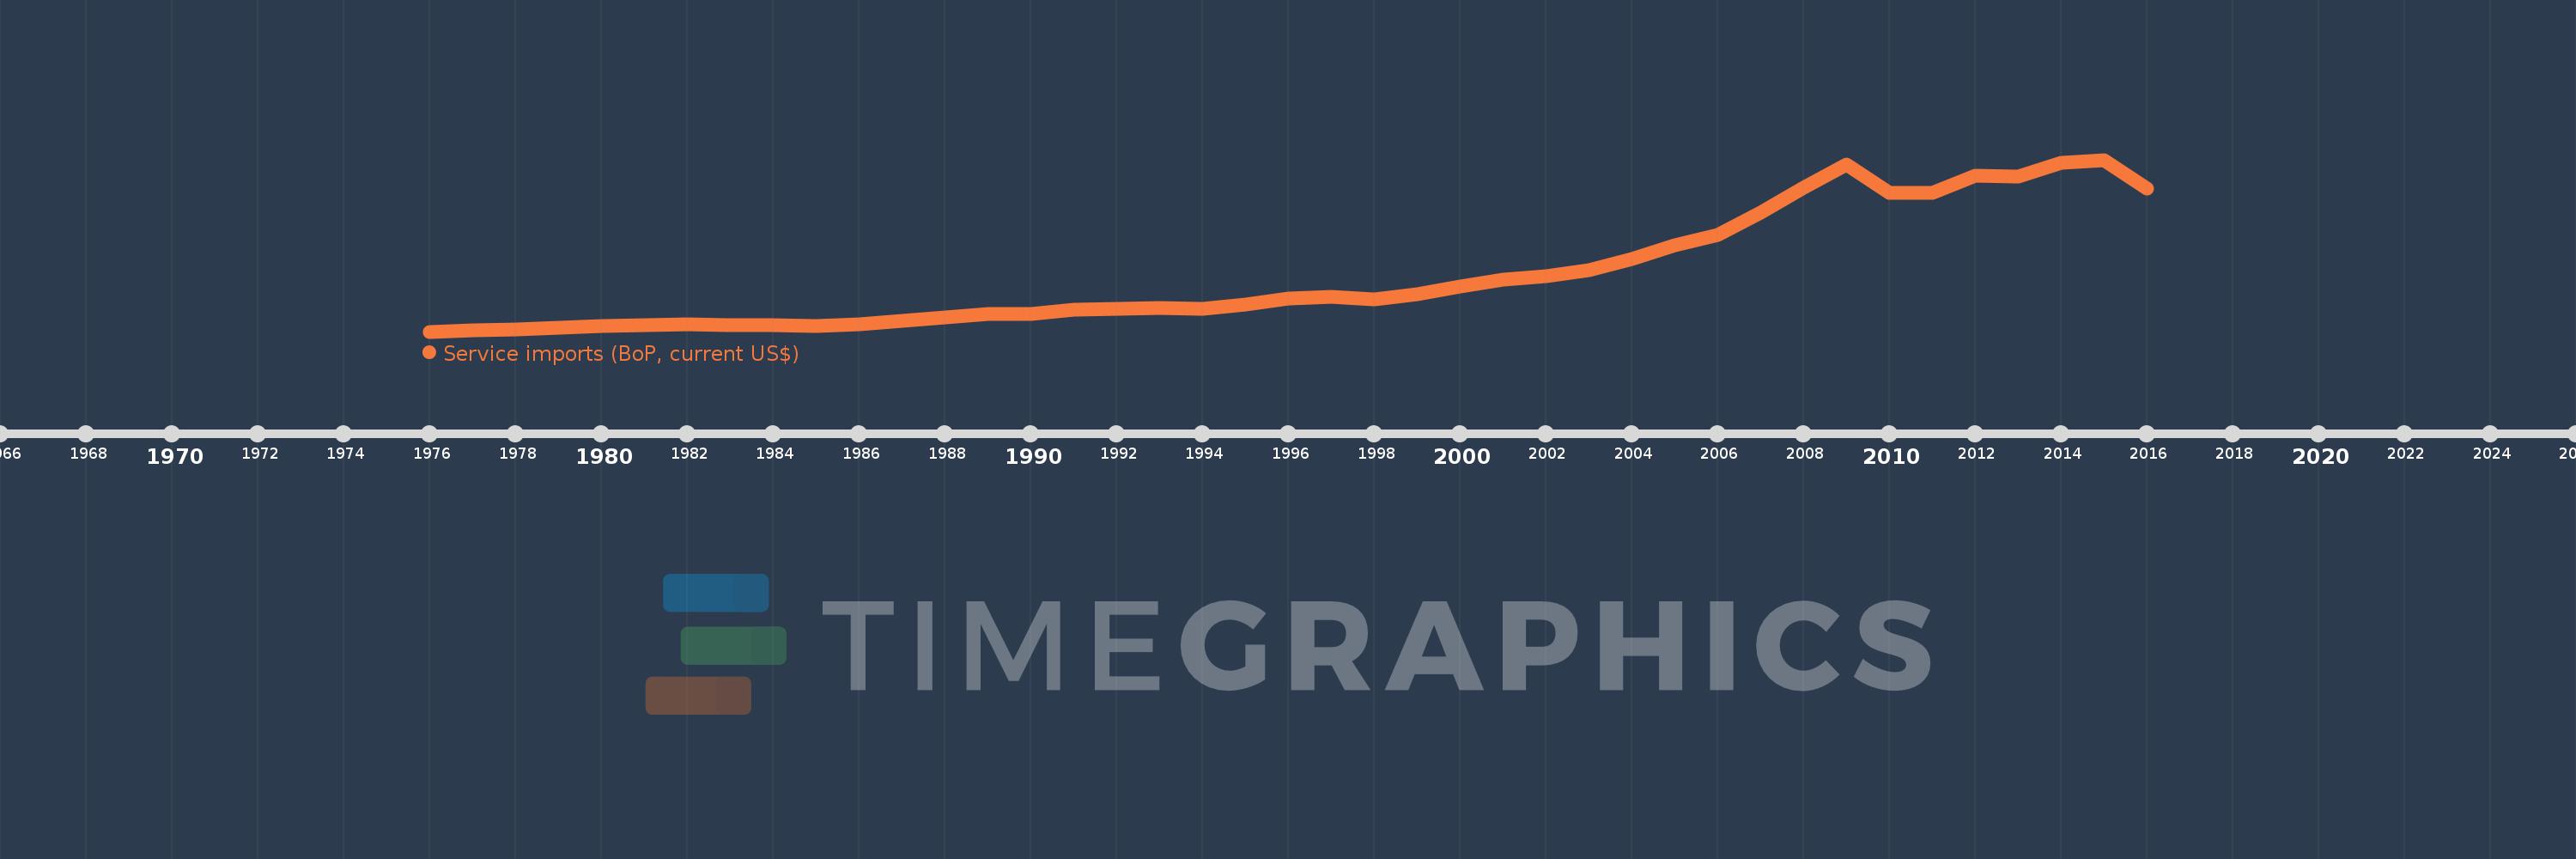
Service imports (BoP, current US$)
2016,2015,2014,2013,2012,2011,2010,2009,2008,2007,2006,2005,2004,2003,2002,2001,2000,1999,1998,1997,1996,1995,1994,1993,1992,1991,1990,1989,1988,1987,1986,1985,1984,1983,1982,1981,1980,1979,1978,1977,1976
This statistics in other country:
AfghanistanAlbaniaAlgeriaAngolaAntigua and BarbudaArab WorldArgentinaArmeniaArubaAustraliaAustriaAzerbaijanBahamas, TheBahrainBangladeshBarbadosBelarusBelgiumBelizeBeninBermudaBhutanBoliviaBosnia and HerzegovinaBotswanaBrazilBrunei DarussalamBulgariaBurkina FasoBurundiCabo VerdeCambodiaCameroonCanadaCaribbean small statesCentral African RepublicCentral Europe and the BalticsChadChileChinaColombiaComorosCongo, Dem. Rep.Congo, Rep.Costa RicaCote d'IvoireCroatiaCuracaoCyprusCzech RepublicDenmarkDjiboutiDominicaDominican RepublicEarly-demographic dividendEast Asia & PacificEast Asia & Pacific (excluding high income)East Asia & Pacific (IDA & IBRD countries)EcuadorEgypt, Arab Rep.El SalvadorEquatorial GuineaEritreaEstoniaEthiopiaEuro areaEurope & Central AsiaEurope & Central Asia (excluding high income)Europe & Central Asia (IDA & IBRD countries)European UnionFaroe IslandsFijiFinlandFragile and conflict affected situationsFranceFrench PolynesiaGabonGambia, TheGeorgiaGermanyGhanaGreeceGrenadaGuatemalaGuineaGuinea-BissauGuyanaHaitiHeavily indebted poor countries (HIPC)High incomeHondurasHong Kong SAR, ChinaHungaryIBRD onlyIcelandIDA & IBRD totalIDA blendIDA onlyIDA totalIndiaIndonesiaIran, Islamic Rep.IraqIrelandIsraelItalyJamaicaJapanJordanKazakhstanKenyaKiribatiKorea, Rep.KosovoKuwaitKyrgyz RepublicLao PDRLate-demographic dividendLatin America & Caribbean Latin America & Caribbean (excluding high income)Latin America & the Caribbean (IDA & IBRD countries)LatviaLeast developed countries: UN classificationLebanonLesothoLiberiaLibyaLithuaniaLow & middle incomeLow incomeLower middle incomeLuxembourgMacao SAR, ChinaMacedonia, FYRMadagascarMalawiMalaysiaMaldivesMaliMaltaMarshall IslandsMauritaniaMauritiusMexicoMicronesia, Fed. Sts.Middle East & North Africa (excluding high income)Middle East & North Africa (IDA & IBRD countries)Middle incomeMoldovaMongoliaMontenegroMoroccoMozambiqueMyanmarNamibiaNepalNetherlandsNew CaledoniaNew ZealandNicaraguaNigerNigeriaNorth AmericaNorwayOECD membersOmanOther small statesPacific island small statesPakistanPalauPanamaPapua New GuineaParaguayPeruPhilippinesPolandPortugalPost-demographic dividendPre-demographic dividendQatarRomaniaRussian FederationRwandaSamoaSao Tome and PrincipeSaudi ArabiaSenegalSerbiaSeychellesSierra LeoneSingaporeSint Maarten (Dutch part)Slovak RepublicSloveniaSmall statesSolomon IslandsSouth AfricaSouth AsiaSouth Asia (IDA & IBRD)South SudanSpainSri LankaSt. Kitts and NevisSt. LuciaSt. Vincent and the GrenadinesSub-Saharan Africa Sub-Saharan Africa (excluding high income)Sub-Saharan Africa (IDA & IBRD countries)SudanSurinameSwazilandSwedenSwitzerlandSyrian Arab RepublicTajikistanTanzaniaThailandTimor-LesteTogoTongaTrinidad and TobagoTunisiaTurkeyTuvaluUgandaUkraineUnited KingdomUnited StatesUpper middle incomeUruguayVanuatuVenezuela, RBVietnamWest Bank and GazaWorldYemen, Rep.ZambiaZimbabwe Timeline:
This timeline shows a graph from 1976 to 2016 of Denmark. No data until 1975. Number of actual observations by date: 41.
Source name:
World Development Indicators
Source organization:
International Monetary Fund, Balance of Payments Statistics Yearbook and data files.
Categories, topics:
Economy & Growth, Trade
Last updated:
apr 23, 2017
Indicators value changes by year
Minimum:
2.159 bln
jan 1, 1976
Maximum:
64.23 bln
jan 1, 2015
At the date of observation
Value
Absolute change
Change from previous value
jan 1, 1976
2.159 bln
+2.159 bln
0.0%
jan 1, 1977
2.48 bln
+320.514 mln
14.84%
jan 1, 1978
2.958 bln
+477.939 mln
19.27%
jan 1, 1979
3.596 bln
+637.994 mln
21.57%
jan 1, 1980
4.292 bln
+696.229 mln
19.36%
jan 1, 1981
4.493 bln
+201.231 mln
4.69%
jan 1, 1982
4.663 bln
+170.302 mln
3.79%
jan 1, 1983
4.538 bln
-125.233 mln
-2.69%
jan 1, 1984
4.501 bln
-36.938 mln
-0.81%
jan 1, 1985
4.301 bln
-199.984 mln
-4.44%
jan 1, 1986
4.794 bln
+492.935 mln
11.46%
jan 1, 1987
6.066 bln
+1.272 bln
26.53%
jan 1, 1988
7.302 bln
+1.236 bln
20.37%
jan 1, 1989
8.427 bln
+1.126 bln
15.42%
jan 1, 1990
8.638 bln
+210.734 mln
2.5%
jan 1, 1991
10.218 bln
+1.58 bln
18.29%
jan 1, 1992
10.42 bln
+202.54 mln
1.98%
jan 1, 1993
10.736 bln
+315.413 mln
3.03%
jan 1, 1994
10.467 bln
-269.087 mln
-2.51%
jan 1, 1995
12.067 bln
+1.6 bln
15.29%
jan 1, 1996
14.04 bln
+1.973 bln
16.35%
jan 1, 1997
14.771 bln
+730.69 mln
5.2%
jan 1, 1998
13.727 bln
-1.044 bln
-7.07%
jan 1, 1999
15.779 bln
+2.052 bln
14.95%
jan 1, 2000
18.402 bln
+2.623 bln
16.62%
jan 1, 2001
21.063 bln
+2.661 bln
14.46%
jan 1, 2002
22.121 bln
+1.058 bln
5.02%
jan 1, 2003
24.305 bln
+2.184 bln
9.87%
jan 1, 2004
28.254 bln
+3.949 bln
16.25%
jan 1, 2005
33.401 bln
+5.147 bln
18.22%
jan 1, 2006
37.002 bln
+3.601 bln
10.78%
jan 1, 2007
45.232 bln
+8.229 bln
22.24%
jan 1, 2008
54.12 bln
+8.888 bln
19.65%
jan 1, 2009
62.583 bln
+8.463 bln
15.64%
jan 1, 2010
52.338 bln
-10.245 bln
-16.37%
jan 1, 2011
52.31 bln
-27.905 mln
-0.05%
jan 1, 2012
58.643 bln
+6.333 bln
12.11%
jan 1, 2013
58.18 bln
-463.371 mln
-0.79%
jan 1, 2014
63.269 bln
+5.089 bln
8.75%
jan 1, 2015
64.23 bln
+961.055 mln
1.52%
jan 1, 2016
53.772 bln
-10.458 bln
-16.28%
Ranking of countries by current statistics by years


Comments: