29
/
en
AIzaSyAYiBZKx7MnpbEhh9jyipgxe19OcubqV5w
April 1, 2024
146332
Guinea
GIN
true
2
1
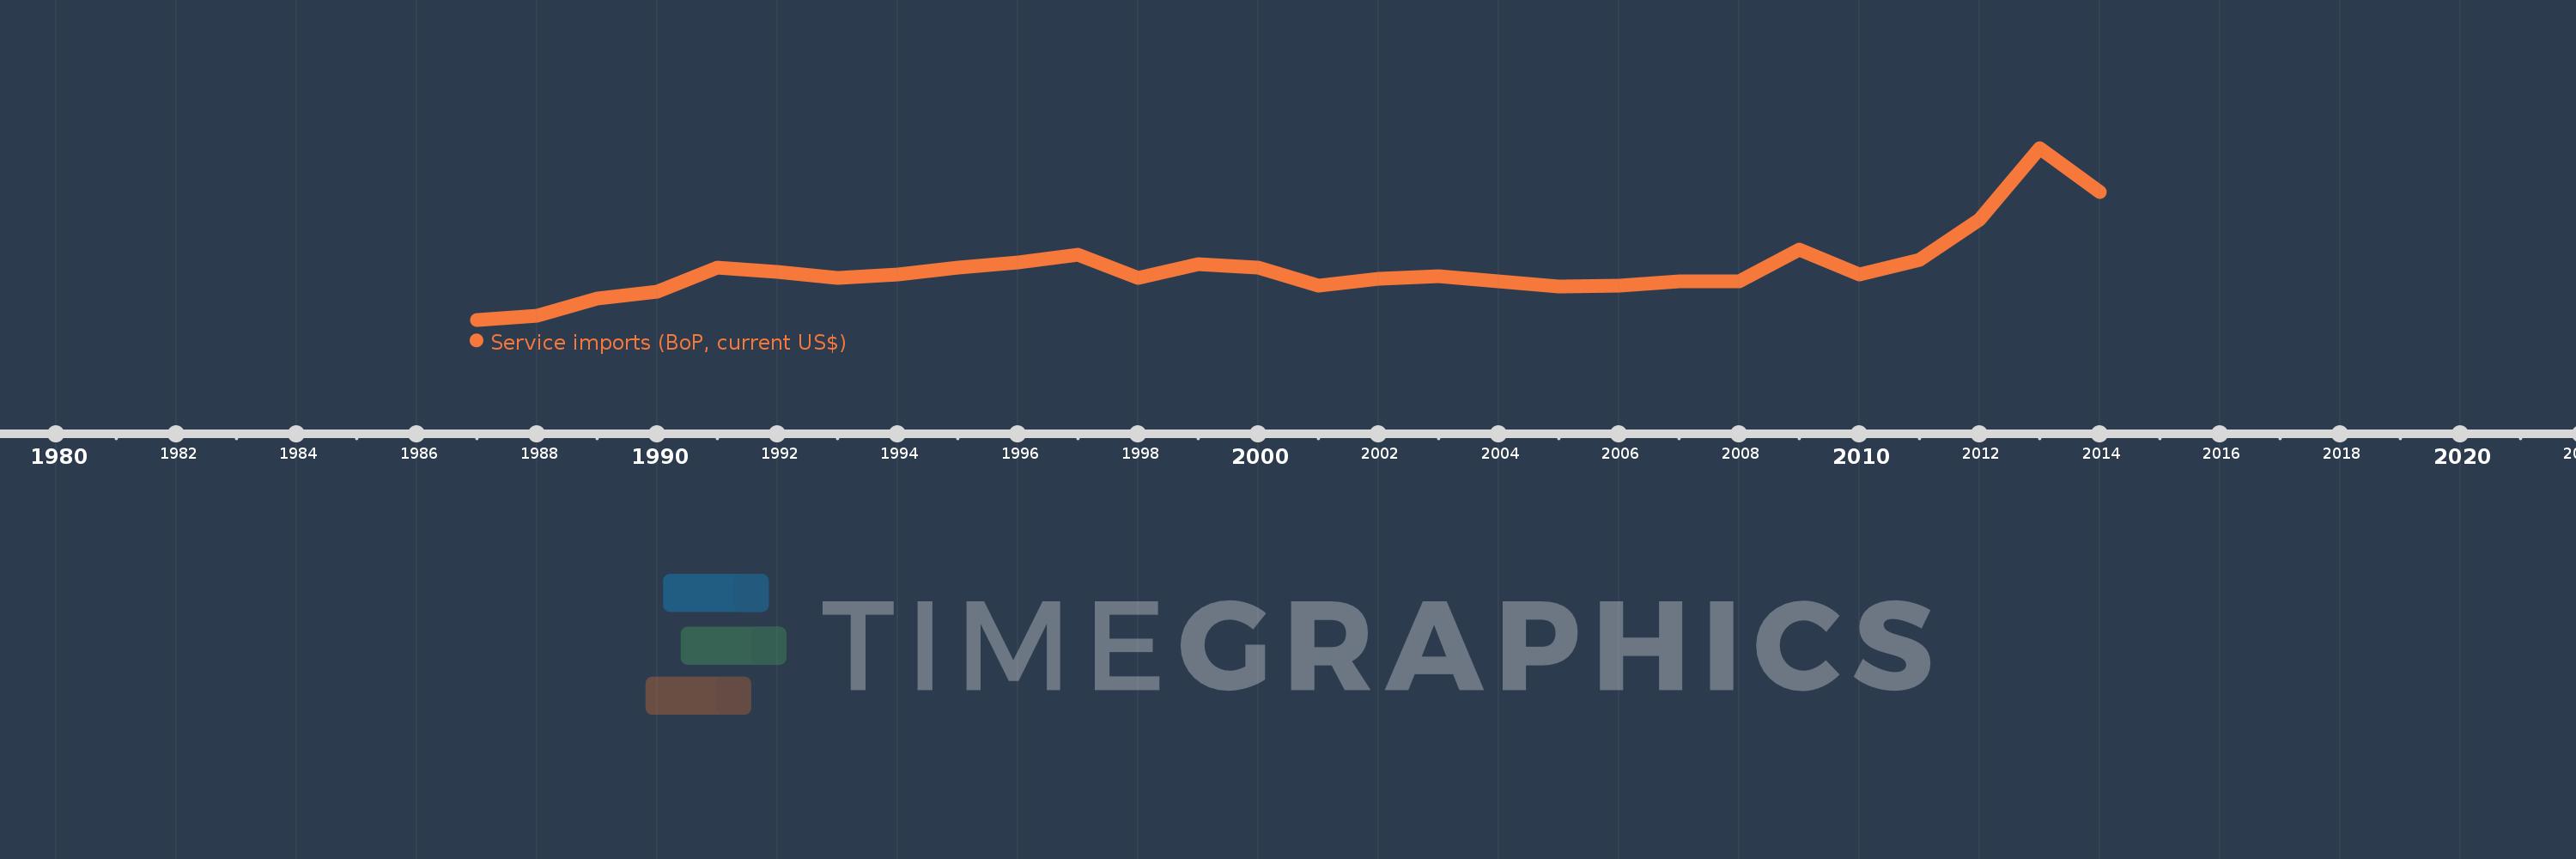
Service imports (BoP, current US$)
2014,2013,2012,2011,2010,2009,2008,2007,2006,2005,2004,2003,2002,2001,2000,1999,1998,1997,1996,1995,1994,1993,1992,1991,1990,1989,1988,1987
This statistics in other country:
AfghanistanAlbaniaAlgeriaAngolaAntigua and BarbudaArab WorldArgentinaArmeniaArubaAustraliaAustriaAzerbaijanBahamas, TheBahrainBangladeshBarbadosBelarusBelgiumBelizeBeninBermudaBhutanBoliviaBosnia and HerzegovinaBotswanaBrazilBrunei DarussalamBulgariaBurkina FasoBurundiCabo VerdeCambodiaCameroonCanadaCaribbean small statesCentral African RepublicCentral Europe and the BalticsChadChileChinaColombiaComorosCongo, Dem. Rep.Congo, Rep.Costa RicaCote d'IvoireCroatiaCuracaoCyprusCzech RepublicDenmarkDjiboutiDominicaDominican RepublicEarly-demographic dividendEast Asia & PacificEast Asia & Pacific (excluding high income)East Asia & Pacific (IDA & IBRD countries)EcuadorEgypt, Arab Rep.El SalvadorEquatorial GuineaEritreaEstoniaEthiopiaEuro areaEurope & Central AsiaEurope & Central Asia (excluding high income)Europe & Central Asia (IDA & IBRD countries)European UnionFaroe IslandsFijiFinlandFragile and conflict affected situationsFranceFrench PolynesiaGabonGambia, TheGeorgiaGermanyGhanaGreeceGrenadaGuatemalaGuineaGuinea-BissauGuyanaHaitiHeavily indebted poor countries (HIPC)High incomeHondurasHong Kong SAR, ChinaHungaryIBRD onlyIcelandIDA & IBRD totalIDA blendIDA onlyIDA totalIndiaIndonesiaIran, Islamic Rep.IraqIrelandIsraelItalyJamaicaJapanJordanKazakhstanKenyaKiribatiKorea, Rep.KosovoKuwaitKyrgyz RepublicLao PDRLate-demographic dividendLatin America & Caribbean Latin America & Caribbean (excluding high income)Latin America & the Caribbean (IDA & IBRD countries)LatviaLeast developed countries: UN classificationLebanonLesothoLiberiaLibyaLithuaniaLow & middle incomeLow incomeLower middle incomeLuxembourgMacao SAR, ChinaMacedonia, FYRMadagascarMalawiMalaysiaMaldivesMaliMaltaMarshall IslandsMauritaniaMauritiusMexicoMicronesia, Fed. Sts.Middle East & North Africa (excluding high income)Middle East & North Africa (IDA & IBRD countries)Middle incomeMoldovaMongoliaMontenegroMoroccoMozambiqueMyanmarNamibiaNepalNetherlandsNew CaledoniaNew ZealandNicaraguaNigerNigeriaNorth AmericaNorwayOECD membersOmanOther small statesPacific island small statesPakistanPalauPanamaPapua New GuineaParaguayPeruPhilippinesPolandPortugalPost-demographic dividendPre-demographic dividendQatarRomaniaRussian FederationRwandaSamoaSao Tome and PrincipeSaudi ArabiaSenegalSerbiaSeychellesSierra LeoneSingaporeSint Maarten (Dutch part)Slovak RepublicSloveniaSmall statesSolomon IslandsSouth AfricaSouth AsiaSouth Asia (IDA & IBRD)South SudanSpainSri LankaSt. Kitts and NevisSt. LuciaSt. Vincent and the GrenadinesSub-Saharan Africa Sub-Saharan Africa (excluding high income)Sub-Saharan Africa (IDA & IBRD countries)SudanSurinameSwazilandSwedenSwitzerlandSyrian Arab RepublicTajikistanTanzaniaThailandTimor-LesteTogoTongaTrinidad and TobagoTunisiaTurkeyTuvaluUgandaUkraineUnited KingdomUnited StatesUpper middle incomeUruguayVanuatuVenezuela, RBVietnamWest Bank and GazaWorldYemen, Rep.ZambiaZimbabwe Timeline:
This timeline shows a graph from 1987 to 2014 of Guinea. No data until 1986. Number of actual observations by date: 28.
Source name:
World Development Indicators
Source organization:
International Monetary Fund, Balance of Payments Statistics Yearbook and data files.
Categories, topics:
Economy & Growth, Trade
Last updated:
apr 23, 2017
Indicators value changes by year
Minimum:
137.36 mln
jan 1, 1987
Maximum:
891.76 mln
jan 1, 2013
At the date of observation
Value
Absolute change
Change from previous value
jan 1, 1987
137.36 mln
+137.36 mln
0.0%
jan 1, 1988
154.0 mln
+16.64 mln
12.11%
jan 1, 1989
230.8 mln
+76.8 mln
49.87%
jan 1, 1990
259.77 mln
+28.97 mln
12.55%
jan 1, 1991
367.25 mln
+107.48 mln
41.38%
jan 1, 1992
347.79 mln
-19.46 mln
-5.3%
jan 1, 1993
322.57 mln
-25.22 mln
-7.25%
jan 1, 1994
334.76 mln
+12.19 mln
3.78%
jan 1, 1995
366.02 mln
+31.26 mln
9.34%
jan 1, 1996
389.333 mln
+23.313 mln
6.37%
jan 1, 1997
423.123 mln
+33.79 mln
8.68%
jan 1, 1998
321.58 mln
-101.543 mln
-24.0%
jan 1, 1999
382.746 mln
+61.166 mln
19.02%
jan 1, 2000
365.157 mln
-17.589 mln
-4.6%
jan 1, 2001
285.904 mln
-79.252 mln
-21.7%
jan 1, 2002
317.691 mln
+31.786 mln
11.12%
jan 1, 2003
329.079 mln
+11.388 mln
3.58%
jan 1, 2004
307.356 mln
-21.723 mln
-6.6%
jan 1, 2005
282.96 mln
-24.396 mln
-7.94%
jan 1, 2006
288.06 mln
+5.1 mln
1.8%
jan 1, 2007
305.37 mln
+17.31 mln
6.01%
jan 1, 2008
306.31 mln
+940.0K
0.31%
jan 1, 2009
446.17 mln
+139.86 mln
45.66%
jan 1, 2010
336.29 mln
-109.88 mln
-24.63%
jan 1, 2011
401.96 mln
+65.67 mln
19.53%
jan 1, 2012
576.08 mln
+174.12 mln
43.32%
jan 1, 2013
891.76 mln
+315.68 mln
54.8%
jan 1, 2014
696.9 mln
-194.86 mln
-21.85%
Ranking of countries by current statistics by years


Comments: