29
/
en
AIzaSyAYiBZKx7MnpbEhh9jyipgxe19OcubqV5w
April 1, 2024
111623
Congo, Rep.
COG
true
2
1
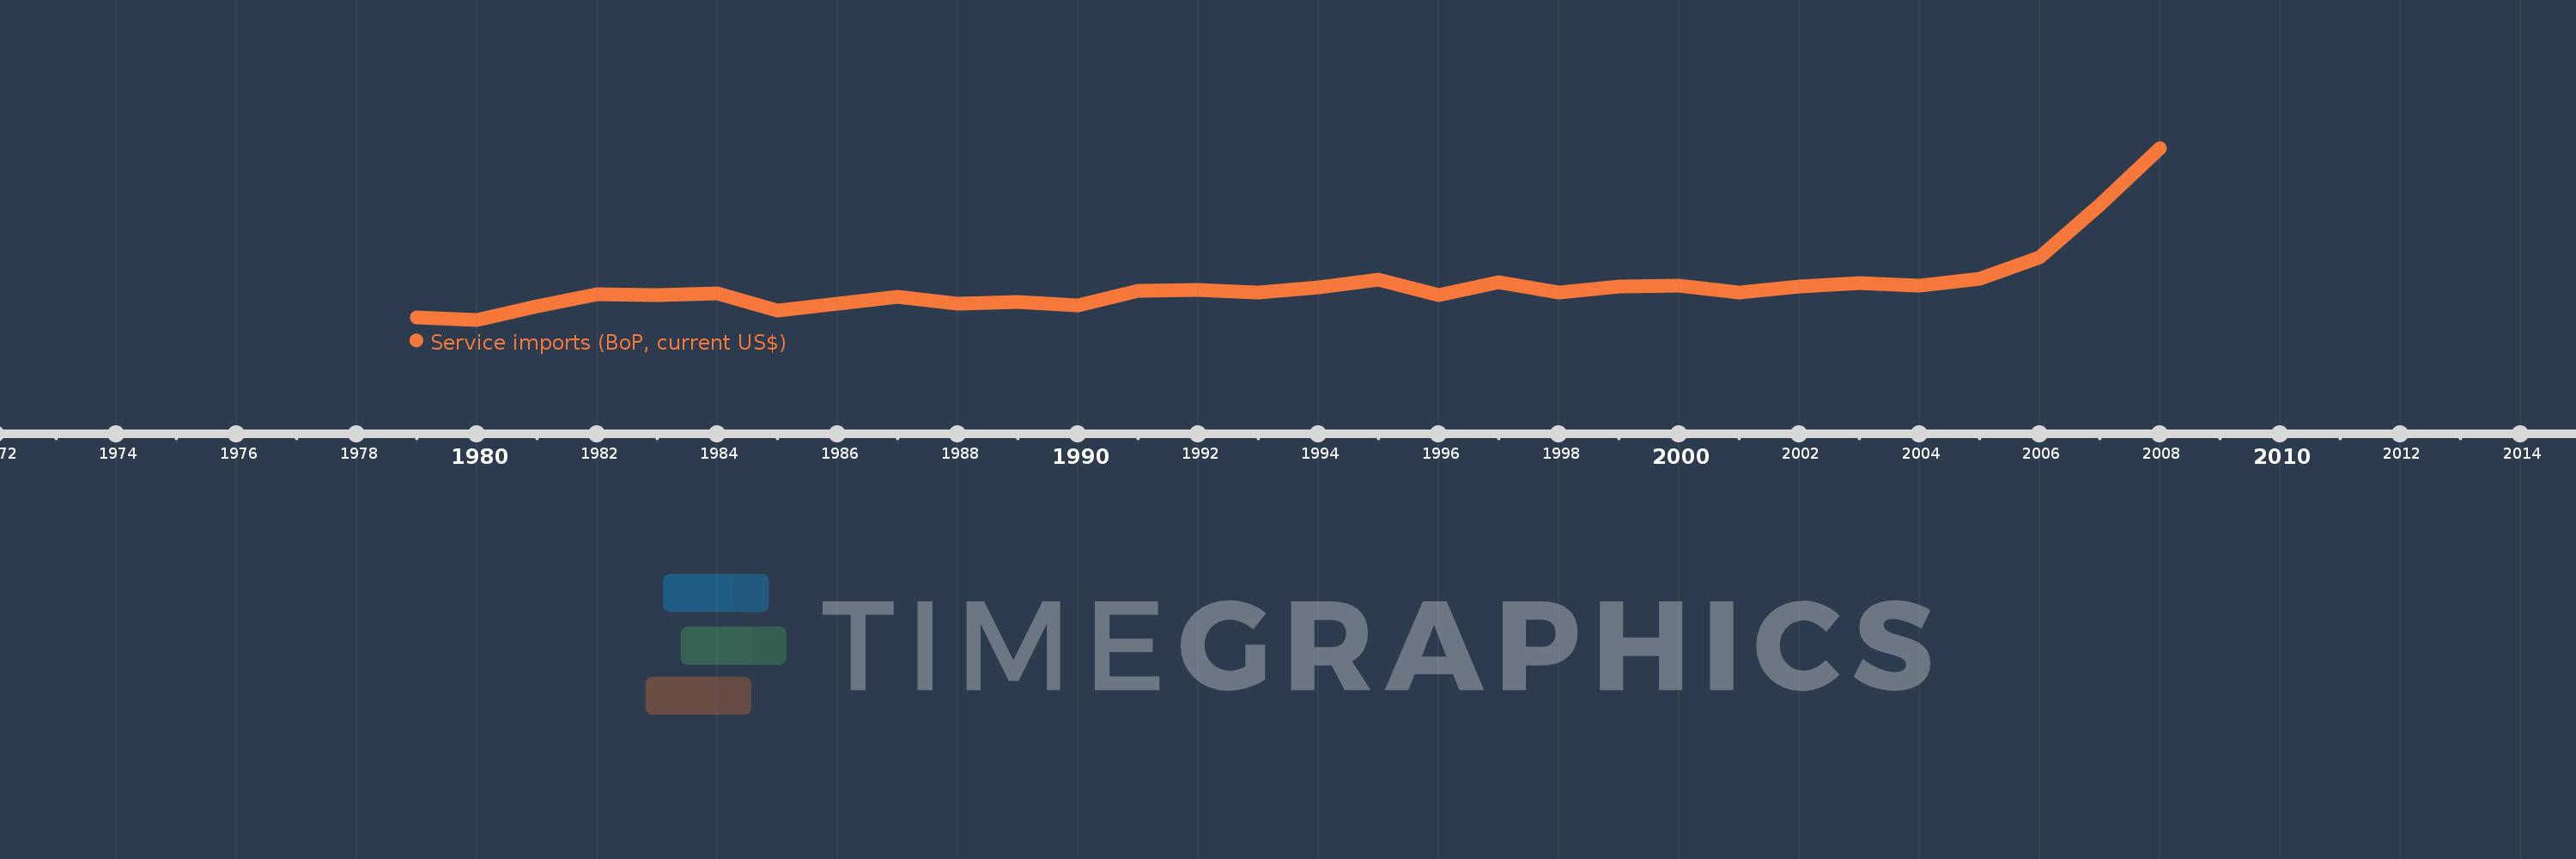
Service imports (BoP, current US$)
2008,2007,2006,2005,2004,2003,2002,2001,2000,1999,1998,1997,1996,1995,1994,1993,1992,1991,1990,1989,1988,1987,1986,1985,1984,1983,1982,1981,1980,1979
This statistics in other country:
AfghanistanAlbaniaAlgeriaAngolaAntigua and BarbudaArab WorldArgentinaArmeniaArubaAustraliaAustriaAzerbaijanBahamas, TheBahrainBangladeshBarbadosBelarusBelgiumBelizeBeninBermudaBhutanBoliviaBosnia and HerzegovinaBotswanaBrazilBrunei DarussalamBulgariaBurkina FasoBurundiCabo VerdeCambodiaCameroonCanadaCaribbean small statesCentral African RepublicCentral Europe and the BalticsChadChileChinaColombiaComorosCongo, Dem. Rep.Congo, Rep.Costa RicaCote d'IvoireCroatiaCuracaoCyprusCzech RepublicDenmarkDjiboutiDominicaDominican RepublicEarly-demographic dividendEast Asia & PacificEast Asia & Pacific (excluding high income)East Asia & Pacific (IDA & IBRD countries)EcuadorEgypt, Arab Rep.El SalvadorEquatorial GuineaEritreaEstoniaEthiopiaEuro areaEurope & Central AsiaEurope & Central Asia (excluding high income)Europe & Central Asia (IDA & IBRD countries)European UnionFaroe IslandsFijiFinlandFragile and conflict affected situationsFranceFrench PolynesiaGabonGambia, TheGeorgiaGermanyGhanaGreeceGrenadaGuatemalaGuineaGuinea-BissauGuyanaHaitiHeavily indebted poor countries (HIPC)High incomeHondurasHong Kong SAR, ChinaHungaryIBRD onlyIcelandIDA & IBRD totalIDA blendIDA onlyIDA totalIndiaIndonesiaIran, Islamic Rep.IraqIrelandIsraelItalyJamaicaJapanJordanKazakhstanKenyaKiribatiKorea, Rep.KosovoKuwaitKyrgyz RepublicLao PDRLate-demographic dividendLatin America & Caribbean Latin America & Caribbean (excluding high income)Latin America & the Caribbean (IDA & IBRD countries)LatviaLeast developed countries: UN classificationLebanonLesothoLiberiaLibyaLithuaniaLow & middle incomeLow incomeLower middle incomeLuxembourgMacao SAR, ChinaMacedonia, FYRMadagascarMalawiMalaysiaMaldivesMaliMaltaMarshall IslandsMauritaniaMauritiusMexicoMicronesia, Fed. Sts.Middle East & North Africa (excluding high income)Middle East & North Africa (IDA & IBRD countries)Middle incomeMoldovaMongoliaMontenegroMoroccoMozambiqueMyanmarNamibiaNepalNetherlandsNew CaledoniaNew ZealandNicaraguaNigerNigeriaNorth AmericaNorwayOECD membersOmanOther small statesPacific island small statesPakistanPalauPanamaPapua New GuineaParaguayPeruPhilippinesPolandPortugalPost-demographic dividendPre-demographic dividendQatarRomaniaRussian FederationRwandaSamoaSao Tome and PrincipeSaudi ArabiaSenegalSerbiaSeychellesSierra LeoneSingaporeSint Maarten (Dutch part)Slovak RepublicSloveniaSmall statesSolomon IslandsSouth AfricaSouth AsiaSouth Asia (IDA & IBRD)South SudanSpainSri LankaSt. Kitts and NevisSt. LuciaSt. Vincent and the GrenadinesSub-Saharan Africa Sub-Saharan Africa (excluding high income)Sub-Saharan Africa (IDA & IBRD countries)SudanSurinameSwazilandSwedenSwitzerlandSyrian Arab RepublicTajikistanTanzaniaThailandTimor-LesteTogoTongaTrinidad and TobagoTunisiaTurkeyTuvaluUgandaUkraineUnited KingdomUnited StatesUpper middle incomeUruguayVanuatuVenezuela, RBVietnamWest Bank and GazaWorldYemen, Rep.ZambiaZimbabwe Timeline:
This timeline shows a graph from 1979 to 2008 of Congo, Rep.. No data until 1978. Number of actual observations by date: 30.
Source name:
World Development Indicators
Source organization:
International Monetary Fund, Balance of Payments Statistics Yearbook and data files.
Categories, topics:
Economy & Growth, Trade
Last updated:
apr 23, 2017
Indicators value changes by year
Minimum:
219.837 mln
jan 1, 1980
Maximum:
3.528 bln
jan 1, 2008
At the date of observation
Value
Absolute change
Change from previous value
jan 1, 1979
259.213 mln
+259.213 mln
0.0%
jan 1, 1980
219.837 mln
-39.377 mln
-15.19%
jan 1, 1981
480.051 mln
+260.215 mln
118.37%
jan 1, 1982
713.292 mln
+233.241 mln
48.59%
jan 1, 1983
697.345 mln
-15.947 mln
-2.24%
jan 1, 1984
727.359 mln
+30.014 mln
4.3%
jan 1, 1985
391.297 mln
-336.062 mln
-46.2%
jan 1, 1986
525.583 mln
+134.286 mln
34.32%
jan 1, 1987
656.795 mln
+131.212 mln
24.97%
jan 1, 1988
532.052 mln
-124.743 mln
-18.99%
jan 1, 1989
560.118 mln
+28.066 mln
5.28%
jan 1, 1990
494.031 mln
-66.086 mln
-11.8%
jan 1, 1991
769.104 mln
+275.073 mln
55.68%
jan 1, 1992
786.581 mln
+17.477 mln
2.27%
jan 1, 1993
737.461 mln
-49.12 mln
-6.24%
jan 1, 1994
845.451 mln
+107.989 mln
14.64%
jan 1, 1995
995.849 mln
+150.398 mln
17.79%
jan 1, 1996
691.692 mln
-304.157 mln
-30.54%
jan 1, 1997
936.015 mln
+244.323 mln
35.32%
jan 1, 1998
748.47 mln
-187.546 mln
-20.04%
jan 1, 1999
857.421 mln
+108.951 mln
14.56%
jan 1, 2000
868.6 mln
+11.179 mln
1.3%
jan 1, 2001
738.334 mln
-130.266 mln
-15.0%
jan 1, 2002
852.165 mln
+113.832 mln
15.42%
jan 1, 2003
926.881 mln
+74.715 mln
8.77%
jan 1, 2004
875.43 mln
-51.451 mln
-5.55%
jan 1, 2005
1.016 bln
+140.878 mln
16.09%
jan 1, 2006
1.417 bln
+400.839 mln
39.44%
jan 1, 2007
2.426 bln
+1.009 bln
71.18%
jan 1, 2008
3.528 bln
+1.102 bln
45.41%
Ranking of countries by current statistics by years


Comments: