29
/
en
AIzaSyAYiBZKx7MnpbEhh9jyipgxe19OcubqV5w
April 1, 2024
26131
Central Europe and the Baltics
CEB
false
2
1
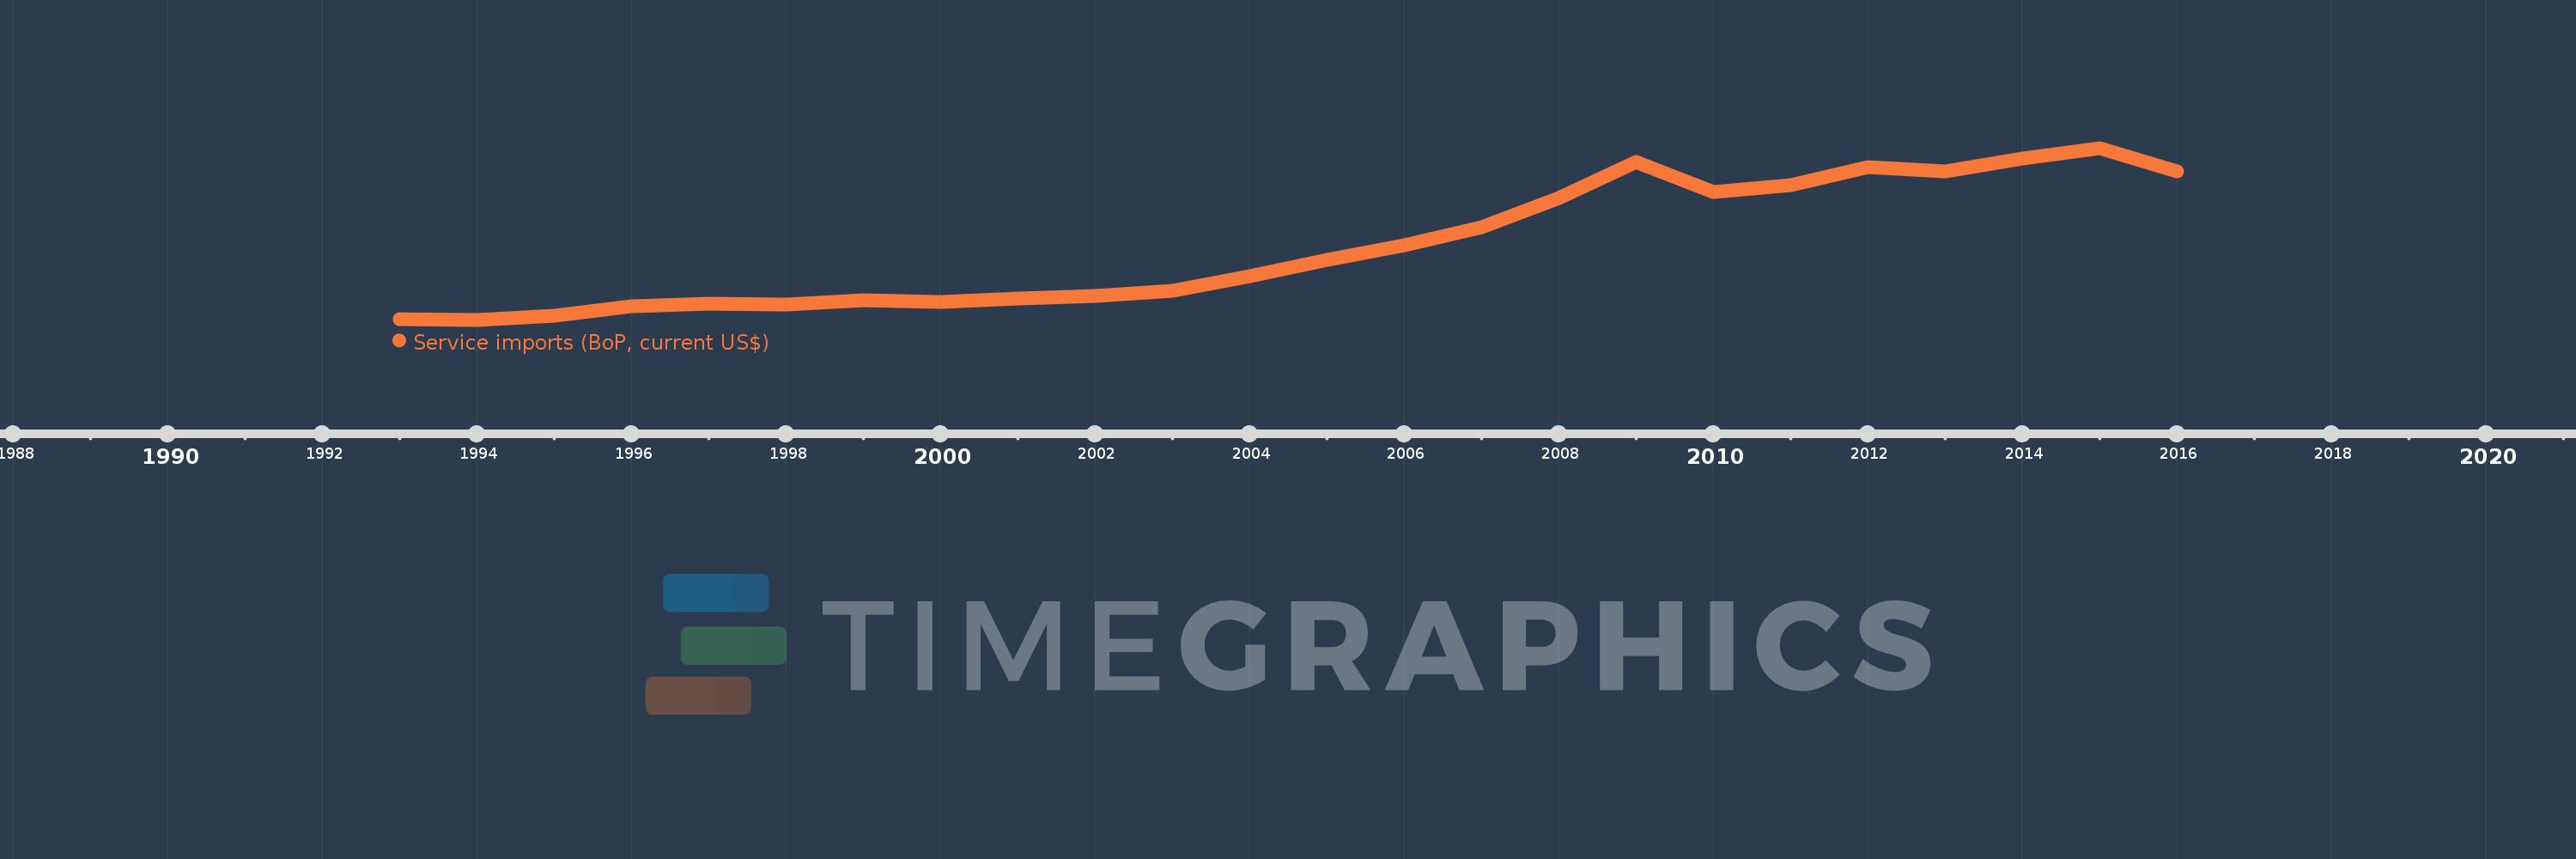
Service imports (BoP, current US$)
2016,2015,2014,2013,2012,2011,2010,2009,2008,2007,2006,2005,2004,2003,2002,2001,2000,1999,1998,1997,1996,1995,1994,1993
This statistics in other country:
AfghanistanAlbaniaAlgeriaAngolaAntigua and BarbudaArab WorldArgentinaArmeniaArubaAustraliaAustriaAzerbaijanBahamas, TheBahrainBangladeshBarbadosBelarusBelgiumBelizeBeninBermudaBhutanBoliviaBosnia and HerzegovinaBotswanaBrazilBrunei DarussalamBulgariaBurkina FasoBurundiCabo VerdeCambodiaCameroonCanadaCaribbean small statesCentral African RepublicCentral Europe and the BalticsChadChileChinaColombiaComorosCongo, Dem. Rep.Congo, Rep.Costa RicaCote d'IvoireCroatiaCuracaoCyprusCzech RepublicDenmarkDjiboutiDominicaDominican RepublicEarly-demographic dividendEast Asia & PacificEast Asia & Pacific (excluding high income)East Asia & Pacific (IDA & IBRD countries)EcuadorEgypt, Arab Rep.El SalvadorEquatorial GuineaEritreaEstoniaEthiopiaEuro areaEurope & Central AsiaEurope & Central Asia (excluding high income)Europe & Central Asia (IDA & IBRD countries)European UnionFaroe IslandsFijiFinlandFragile and conflict affected situationsFranceFrench PolynesiaGabonGambia, TheGeorgiaGermanyGhanaGreeceGrenadaGuatemalaGuineaGuinea-BissauGuyanaHaitiHeavily indebted poor countries (HIPC)High incomeHondurasHong Kong SAR, ChinaHungaryIBRD onlyIcelandIDA & IBRD totalIDA blendIDA onlyIDA totalIndiaIndonesiaIran, Islamic Rep.IraqIrelandIsraelItalyJamaicaJapanJordanKazakhstanKenyaKiribatiKorea, Rep.KosovoKuwaitKyrgyz RepublicLao PDRLate-demographic dividendLatin America & Caribbean Latin America & Caribbean (excluding high income)Latin America & the Caribbean (IDA & IBRD countries)LatviaLeast developed countries: UN classificationLebanonLesothoLiberiaLibyaLithuaniaLow & middle incomeLow incomeLower middle incomeLuxembourgMacao SAR, ChinaMacedonia, FYRMadagascarMalawiMalaysiaMaldivesMaliMaltaMarshall IslandsMauritaniaMauritiusMexicoMicronesia, Fed. Sts.Middle East & North Africa (excluding high income)Middle East & North Africa (IDA & IBRD countries)Middle incomeMoldovaMongoliaMontenegroMoroccoMozambiqueMyanmarNamibiaNepalNetherlandsNew CaledoniaNew ZealandNicaraguaNigerNigeriaNorth AmericaNorwayOECD membersOmanOther small statesPacific island small statesPakistanPalauPanamaPapua New GuineaParaguayPeruPhilippinesPolandPortugalPost-demographic dividendPre-demographic dividendQatarRomaniaRussian FederationRwandaSamoaSao Tome and PrincipeSaudi ArabiaSenegalSerbiaSeychellesSierra LeoneSingaporeSint Maarten (Dutch part)Slovak RepublicSloveniaSmall statesSolomon IslandsSouth AfricaSouth AsiaSouth Asia (IDA & IBRD)South SudanSpainSri LankaSt. Kitts and NevisSt. LuciaSt. Vincent and the GrenadinesSub-Saharan Africa Sub-Saharan Africa (excluding high income)Sub-Saharan Africa (IDA & IBRD countries)SudanSurinameSwazilandSwedenSwitzerlandSyrian Arab RepublicTajikistanTanzaniaThailandTimor-LesteTogoTongaTrinidad and TobagoTunisiaTurkeyTuvaluUgandaUkraineUnited KingdomUnited StatesUpper middle incomeUruguayVanuatuVenezuela, RBVietnamWest Bank and GazaWorldYemen, Rep.ZambiaZimbabwe Timeline:
This timeline shows a graph from 1993 to 2016 of Central Europe and the Baltics. No data until 1992. Number of actual observations by date: 24.
Source name:
World Development Indicators
Source organization:
International Monetary Fund, Balance of Payments Statistics Yearbook and data files.
Categories, topics:
Economy & Growth, Trade
Last updated:
apr 23, 2017
Indicators value changes by year
Minimum:
16.755 bln
jan 1, 1994
Maximum:
126.29 bln
jan 1, 2015
At the date of observation
Value
Absolute change
Change from previous value
jan 1, 1993
17.22 bln
+17.22 bln
0.0%
jan 1, 1994
16.755 bln
-465.318 mln
-2.7%
jan 1, 1995
19.187 bln
+2.432 bln
14.52%
jan 1, 1996
25.139 bln
+5.952 bln
31.02%
jan 1, 1997
27.202 bln
+2.063 bln
8.21%
jan 1, 1998
26.308 bln
-893.762 mln
-3.29%
jan 1, 1999
29.433 bln
+3.124 bln
11.88%
jan 1, 2000
28.296 bln
-1.137 bln
-3.86%
jan 1, 2001
30.16 bln
+1.864 bln
6.59%
jan 1, 2002
31.985 bln
+1.826 bln
6.05%
jan 1, 2003
35.472 bln
+3.487 bln
10.9%
jan 1, 2004
44.424 bln
+8.952 bln
25.24%
jan 1, 2005
54.803 bln
+10.379 bln
23.36%
jan 1, 2006
64.292 bln
+9.49 bln
17.32%
jan 1, 2007
75.623 bln
+11.33 bln
17.62%
jan 1, 2008
94.577 bln
+18.954 bln
25.06%
jan 1, 2009
117.526 bln
+22.95 bln
24.27%
jan 1, 2010
98.198 bln
-19.329 bln
-16.45%
jan 1, 2011
102.451 bln
+4.253 bln
4.33%
jan 1, 2012
113.883 bln
+11.432 bln
11.16%
jan 1, 2013
111.128 bln
-2.754 bln
-2.42%
jan 1, 2014
119.662 bln
+8.534 bln
7.68%
jan 1, 2015
126.29 bln
+6.627 bln
5.54%
jan 1, 2016
111.431 bln
-14.858 bln
-11.77%
Ranking of countries by current statistics by years


Comments: