29
/
en
AIzaSyAYiBZKx7MnpbEhh9jyipgxe19OcubqV5w
April 1, 2024
35382
Heavily indebted poor countries (HIPC)
HPC
false
2
1
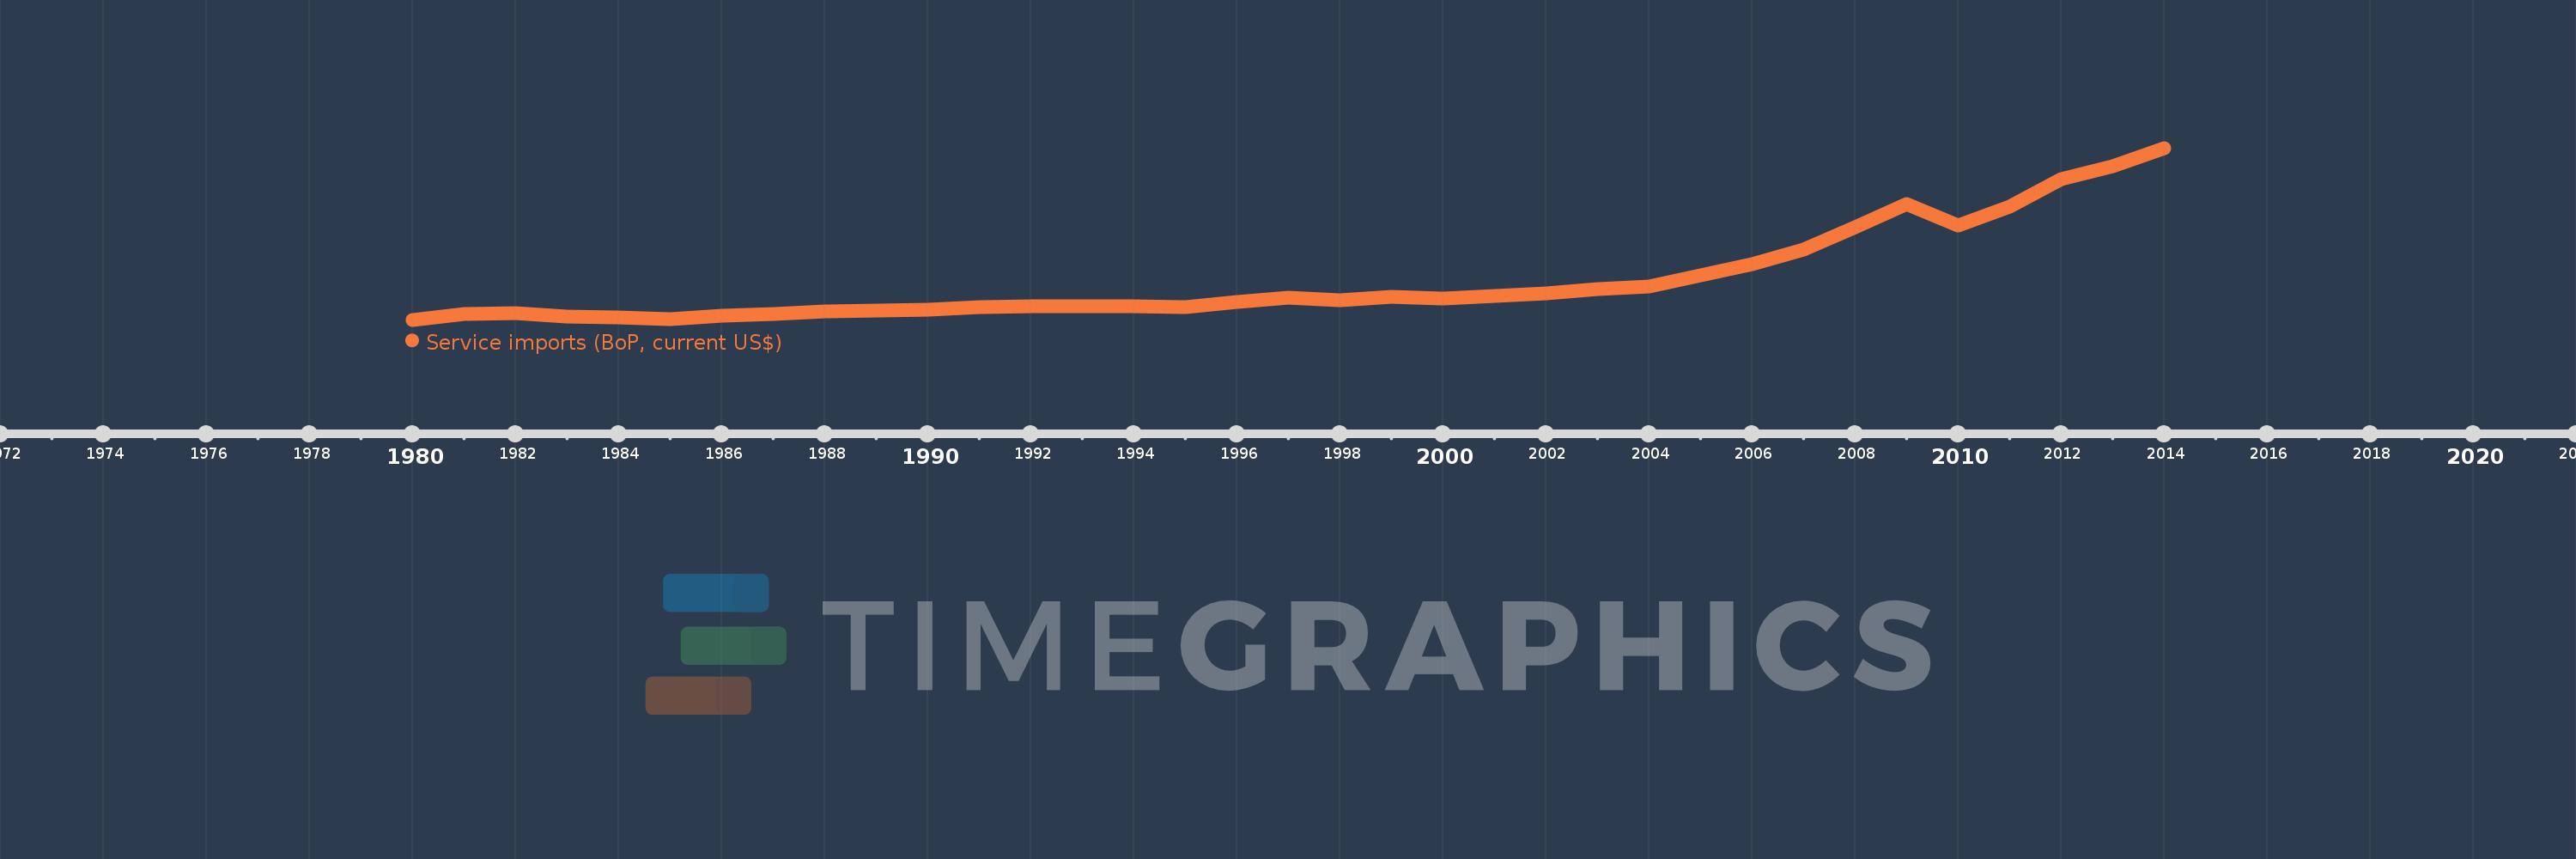
Service imports (BoP, current US$)
2014,2013,2012,2011,2010,2009,2008,2007,2006,2005,2004,2003,2002,2001,2000,1999,1998,1997,1996,1995,1994,1993,1992,1991,1990,1989,1988,1987,1986,1985,1984,1983,1982,1981,1980
This statistics in other country:
AfghanistanAlbaniaAlgeriaAngolaAntigua and BarbudaArab WorldArgentinaArmeniaArubaAustraliaAustriaAzerbaijanBahamas, TheBahrainBangladeshBarbadosBelarusBelgiumBelizeBeninBermudaBhutanBoliviaBosnia and HerzegovinaBotswanaBrazilBrunei DarussalamBulgariaBurkina FasoBurundiCabo VerdeCambodiaCameroonCanadaCaribbean small statesCentral African RepublicCentral Europe and the BalticsChadChileChinaColombiaComorosCongo, Dem. Rep.Congo, Rep.Costa RicaCote d'IvoireCroatiaCuracaoCyprusCzech RepublicDenmarkDjiboutiDominicaDominican RepublicEarly-demographic dividendEast Asia & PacificEast Asia & Pacific (excluding high income)East Asia & Pacific (IDA & IBRD countries)EcuadorEgypt, Arab Rep.El SalvadorEquatorial GuineaEritreaEstoniaEthiopiaEuro areaEurope & Central AsiaEurope & Central Asia (excluding high income)Europe & Central Asia (IDA & IBRD countries)European UnionFaroe IslandsFijiFinlandFragile and conflict affected situationsFranceFrench PolynesiaGabonGambia, TheGeorgiaGermanyGhanaGreeceGrenadaGuatemalaGuineaGuinea-BissauGuyanaHaitiHeavily indebted poor countries (HIPC)High incomeHondurasHong Kong SAR, ChinaHungaryIBRD onlyIcelandIDA & IBRD totalIDA blendIDA onlyIDA totalIndiaIndonesiaIran, Islamic Rep.IraqIrelandIsraelItalyJamaicaJapanJordanKazakhstanKenyaKiribatiKorea, Rep.KosovoKuwaitKyrgyz RepublicLao PDRLate-demographic dividendLatin America & Caribbean Latin America & Caribbean (excluding high income)Latin America & the Caribbean (IDA & IBRD countries)LatviaLeast developed countries: UN classificationLebanonLesothoLiberiaLibyaLithuaniaLow & middle incomeLow incomeLower middle incomeLuxembourgMacao SAR, ChinaMacedonia, FYRMadagascarMalawiMalaysiaMaldivesMaliMaltaMarshall IslandsMauritaniaMauritiusMexicoMicronesia, Fed. Sts.Middle East & North Africa (excluding high income)Middle East & North Africa (IDA & IBRD countries)Middle incomeMoldovaMongoliaMontenegroMoroccoMozambiqueMyanmarNamibiaNepalNetherlandsNew CaledoniaNew ZealandNicaraguaNigerNigeriaNorth AmericaNorwayOECD membersOmanOther small statesPacific island small statesPakistanPalauPanamaPapua New GuineaParaguayPeruPhilippinesPolandPortugalPost-demographic dividendPre-demographic dividendQatarRomaniaRussian FederationRwandaSamoaSao Tome and PrincipeSaudi ArabiaSenegalSerbiaSeychellesSierra LeoneSingaporeSint Maarten (Dutch part)Slovak RepublicSloveniaSmall statesSolomon IslandsSouth AfricaSouth AsiaSouth Asia (IDA & IBRD)South SudanSpainSri LankaSt. Kitts and NevisSt. LuciaSt. Vincent and the GrenadinesSub-Saharan Africa Sub-Saharan Africa (excluding high income)Sub-Saharan Africa (IDA & IBRD countries)SudanSurinameSwazilandSwedenSwitzerlandSyrian Arab RepublicTajikistanTanzaniaThailandTimor-LesteTogoTongaTrinidad and TobagoTunisiaTurkeyTuvaluUgandaUkraineUnited KingdomUnited StatesUpper middle incomeUruguayVanuatuVenezuela, RBVietnamWest Bank and GazaWorldYemen, Rep.ZambiaZimbabwe Timeline:
This timeline shows a graph from 1980 to 2014 of Heavily indebted poor countries (HIPC). No data until 1979. Number of actual observations by date: 35.
Source name:
World Development Indicators
Source organization:
International Monetary Fund, Balance of Payments Statistics Yearbook and data files.
Categories, topics:
Economy & Growth, Trade
Last updated:
apr 23, 2017
Indicators value changes by year
Minimum:
6.783 bln
jan 1, 1980
Maximum:
55.555 bln
jan 1, 2014
At the date of observation
Value
Absolute change
Change from previous value
jan 1, 1980
6.783 bln
+6.783 bln
0.0%
jan 1, 1981
8.358 bln
+1.575 bln
23.22%
jan 1, 1982
8.571 bln
+213.512 mln
2.55%
jan 1, 1983
7.78 bln
-791.168 mln
-9.23%
jan 1, 1984
7.445 bln
-335.156 mln
-4.31%
jan 1, 1985
7.03 bln
-414.772 mln
-5.57%
jan 1, 1986
7.919 bln
+888.722 mln
12.64%
jan 1, 1987
8.399 bln
+480.027 mln
6.06%
jan 1, 1988
9.101 bln
+701.918 mln
8.36%
jan 1, 1989
9.277 bln
+175.728 mln
1.93%
jan 1, 1990
9.669 bln
+392.688 mln
4.23%
jan 1, 1991
10.419 bln
+750.114 mln
7.76%
jan 1, 1992
10.594 bln
+174.661 mln
1.68%
jan 1, 1993
10.654 bln
+60.325 mln
0.57%
jan 1, 1994
10.707 bln
+52.511 mln
0.49%
jan 1, 1995
10.402 bln
-304.631 mln
-2.85%
jan 1, 1996
11.767 bln
+1.365 bln
13.12%
jan 1, 1997
12.979 bln
+1.212 bln
10.3%
jan 1, 1998
12.321 bln
-658.397 mln
-5.07%
jan 1, 1999
13.295 bln
+974.157 mln
7.91%
jan 1, 2000
12.807 bln
-487.804 mln
-3.67%
jan 1, 2001
13.618 bln
+810.498 mln
6.33%
jan 1, 2002
14.167 bln
+549.423 mln
4.03%
jan 1, 2003
15.391 bln
+1.224 bln
8.64%
jan 1, 2004
16.341 bln
+950.567 mln
6.18%
jan 1, 2005
19.375 bln
+3.034 bln
18.56%
jan 1, 2006
22.515 bln
+3.14 bln
16.21%
jan 1, 2007
26.763 bln
+4.249 bln
18.87%
jan 1, 2008
33.079 bln
+6.316 bln
23.6%
jan 1, 2009
39.635 bln
+6.555 bln
19.82%
jan 1, 2010
33.572 bln
-6.062 bln
-15.3%
jan 1, 2011
38.966 bln
+5.393 bln
16.07%
jan 1, 2012
46.653 bln
+7.688 bln
19.73%
jan 1, 2013
50.354 bln
+3.701 bln
7.93%
jan 1, 2014
55.555 bln
+5.201 bln
10.33%
Ranking of countries by current statistics by years


Comments: