29
/
en
AIzaSyAYiBZKx7MnpbEhh9jyipgxe19OcubqV5w
April 1, 2024
107988
Colombia
COL
true
2
1
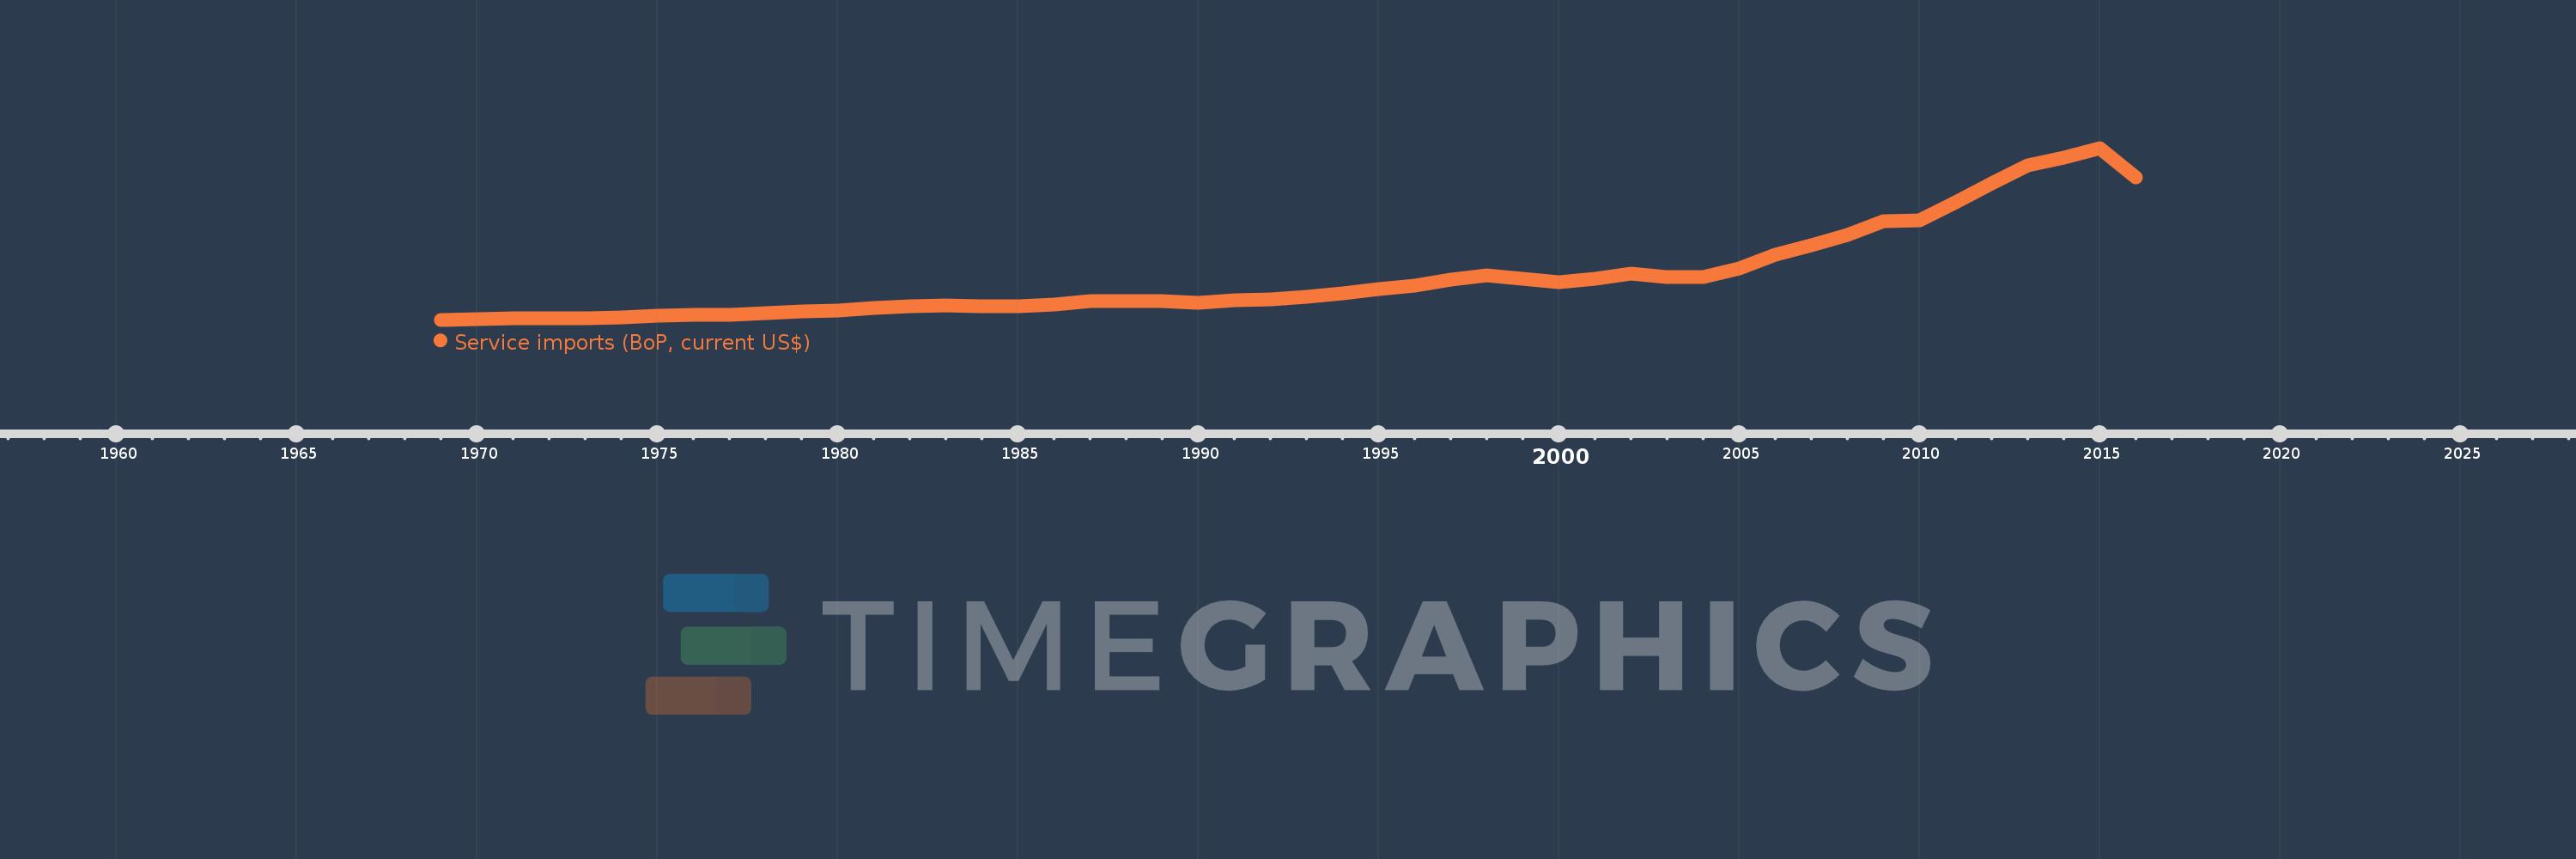
Service imports (BoP, current US$)
2016,2015,2014,2013,2012,2011,2010,2009,2008,2007,2006,2005,2004,2003,2002,2001,2000,1999,1998,1997,1996,1995,1994,1993,1992,1991,1990,1989,1988,1987,1986,1985,1984,1983,1982,1981,1980,1979,1978,1977,1976,1975,1974,1973,1972,1971,1970,1969
This statistics in other country:
AfghanistanAlbaniaAlgeriaAngolaAntigua and BarbudaArab WorldArgentinaArmeniaArubaAustraliaAustriaAzerbaijanBahamas, TheBahrainBangladeshBarbadosBelarusBelgiumBelizeBeninBermudaBhutanBoliviaBosnia and HerzegovinaBotswanaBrazilBrunei DarussalamBulgariaBurkina FasoBurundiCabo VerdeCambodiaCameroonCanadaCaribbean small statesCentral African RepublicCentral Europe and the BalticsChadChileChinaColombiaComorosCongo, Dem. Rep.Congo, Rep.Costa RicaCote d'IvoireCroatiaCuracaoCyprusCzech RepublicDenmarkDjiboutiDominicaDominican RepublicEarly-demographic dividendEast Asia & PacificEast Asia & Pacific (excluding high income)East Asia & Pacific (IDA & IBRD countries)EcuadorEgypt, Arab Rep.El SalvadorEquatorial GuineaEritreaEstoniaEthiopiaEuro areaEurope & Central AsiaEurope & Central Asia (excluding high income)Europe & Central Asia (IDA & IBRD countries)European UnionFaroe IslandsFijiFinlandFragile and conflict affected situationsFranceFrench PolynesiaGabonGambia, TheGeorgiaGermanyGhanaGreeceGrenadaGuatemalaGuineaGuinea-BissauGuyanaHaitiHeavily indebted poor countries (HIPC)High incomeHondurasHong Kong SAR, ChinaHungaryIBRD onlyIcelandIDA & IBRD totalIDA blendIDA onlyIDA totalIndiaIndonesiaIran, Islamic Rep.IraqIrelandIsraelItalyJamaicaJapanJordanKazakhstanKenyaKiribatiKorea, Rep.KosovoKuwaitKyrgyz RepublicLao PDRLate-demographic dividendLatin America & Caribbean Latin America & Caribbean (excluding high income)Latin America & the Caribbean (IDA & IBRD countries)LatviaLeast developed countries: UN classificationLebanonLesothoLiberiaLibyaLithuaniaLow & middle incomeLow incomeLower middle incomeLuxembourgMacao SAR, ChinaMacedonia, FYRMadagascarMalawiMalaysiaMaldivesMaliMaltaMarshall IslandsMauritaniaMauritiusMexicoMicronesia, Fed. Sts.Middle East & North Africa (excluding high income)Middle East & North Africa (IDA & IBRD countries)Middle incomeMoldovaMongoliaMontenegroMoroccoMozambiqueMyanmarNamibiaNepalNetherlandsNew CaledoniaNew ZealandNicaraguaNigerNigeriaNorth AmericaNorwayOECD membersOmanOther small statesPacific island small statesPakistanPalauPanamaPapua New GuineaParaguayPeruPhilippinesPolandPortugalPost-demographic dividendPre-demographic dividendQatarRomaniaRussian FederationRwandaSamoaSao Tome and PrincipeSaudi ArabiaSenegalSerbiaSeychellesSierra LeoneSingaporeSint Maarten (Dutch part)Slovak RepublicSloveniaSmall statesSolomon IslandsSouth AfricaSouth AsiaSouth Asia (IDA & IBRD)South SudanSpainSri LankaSt. Kitts and NevisSt. LuciaSt. Vincent and the GrenadinesSub-Saharan Africa Sub-Saharan Africa (excluding high income)Sub-Saharan Africa (IDA & IBRD countries)SudanSurinameSwazilandSwedenSwitzerlandSyrian Arab RepublicTajikistanTanzaniaThailandTimor-LesteTogoTongaTrinidad and TobagoTunisiaTurkeyTuvaluUgandaUkraineUnited KingdomUnited StatesUpper middle incomeUruguayVanuatuVenezuela, RBVietnamWest Bank and GazaWorldYemen, Rep.ZambiaZimbabwe Timeline:
This timeline shows a graph from 1969 to 2016 of Colombia. No data until 1968. Number of actual observations by date: 48.
Source name:
World Development Indicators
Source organization:
International Monetary Fund, Balance of Payments Statistics Yearbook and data files.
Categories, topics:
Economy & Growth, Trade
Last updated:
apr 23, 2017
Indicators value changes by year
Minimum:
243.0 mln
jan 1, 1969
Maximum:
13.571 bln
jan 1, 2015
At the date of observation
Value
Absolute change
Change from previous value
jan 1, 1969
243.0 mln
+243.0 mln
0.0%
jan 1, 1970
283.0 mln
+40.0 mln
16.46%
jan 1, 1971
334.0 mln
+51.0 mln
18.02%
jan 1, 1972
382.025 mln
+48.025 mln
14.38%
jan 1, 1973
383.17 mln
+1.145 mln
0.3%
jan 1, 1974
439.708 mln
+56.538 mln
14.76%
jan 1, 1975
565.972 mln
+126.264 mln
28.72%
jan 1, 1976
597.258 mln
+31.286 mln
5.53%
jan 1, 1977
647.324 mln
+50.065 mln
8.38%
jan 1, 1978
773.239 mln
+125.915 mln
19.45%
jan 1, 1979
856.912 mln
+83.673 mln
10.82%
jan 1, 1980
940.932 mln
+84.02 mln
9.8%
jan 1, 1981
1.17 bln
+229.546 mln
24.4%
jan 1, 1982
1.295 bln
+124.585 mln
10.64%
jan 1, 1983
1.346 bln
+51.01 mln
3.94%
jan 1, 1984
1.302 bln
-44.073 mln
-3.27%
jan 1, 1985
1.298 bln
-4.0 mln
-0.31%
jan 1, 1986
1.427 bln
+129.0 mln
9.94%
jan 1, 1987
1.684 bln
+257.0 mln
18.01%
jan 1, 1988
1.709 bln
+25.0 mln
1.48%
jan 1, 1989
1.67 bln
-39.0 mln
-2.28%
jan 1, 1990
1.565 bln
-105.0 mln
-6.29%
jan 1, 1991
1.75 bln
+185.0 mln
11.82%
jan 1, 1992
1.812 bln
+62.0 mln
3.54%
jan 1, 1993
2.028 bln
+216.3 mln
11.94%
jan 1, 1994
2.321 bln
+292.4 mln
14.42%
jan 1, 1995
2.605 bln
+284.741 mln
12.27%
jan 1, 1996
2.86 bln
+254.481 mln
9.77%
jan 1, 1997
3.385 bln
+524.818 mln
18.35%
jan 1, 1998
3.687 bln
+302.009 mln
8.92%
jan 1, 1999
3.414 bln
-272.425 mln
-7.39%
jan 1, 2000
3.142 bln
-272.343 mln
-7.98%
jan 1, 2001
3.447 bln
+304.825 mln
9.7%
jan 1, 2002
3.801 bln
+354.016 mln
10.27%
jan 1, 2003
3.549 bln
-251.701 mln
-6.62%
jan 1, 2004
3.56 bln
+10.929 mln
0.31%
jan 1, 2005
4.251 bln
+691.308 mln
19.42%
jan 1, 2006
5.318 bln
+1.067 bln
25.1%
jan 1, 2007
6.041 bln
+722.605 mln
13.59%
jan 1, 2008
6.825 bln
+783.594 mln
12.97%
jan 1, 2009
7.902 bln
+1.077 bln
15.79%
jan 1, 2010
7.982 bln
+79.497 mln
1.01%
jan 1, 2011
9.363 bln
+1.381 bln
17.3%
jan 1, 2012
10.838 bln
+1.475 bln
15.76%
jan 1, 2013
12.246 bln
+1.409 bln
13.0%
jan 1, 2014
12.812 bln
+565.472 mln
4.62%
jan 1, 2015
13.571 bln
+758.738 mln
5.92%
jan 1, 2016
11.304 bln
-2.267 bln
-16.71%
Ranking of countries by current statistics by years


Comments: