29
/
en
AIzaSyAYiBZKx7MnpbEhh9jyipgxe19OcubqV5w
April 1, 2024
204728
Myanmar
MMR
true
2
1
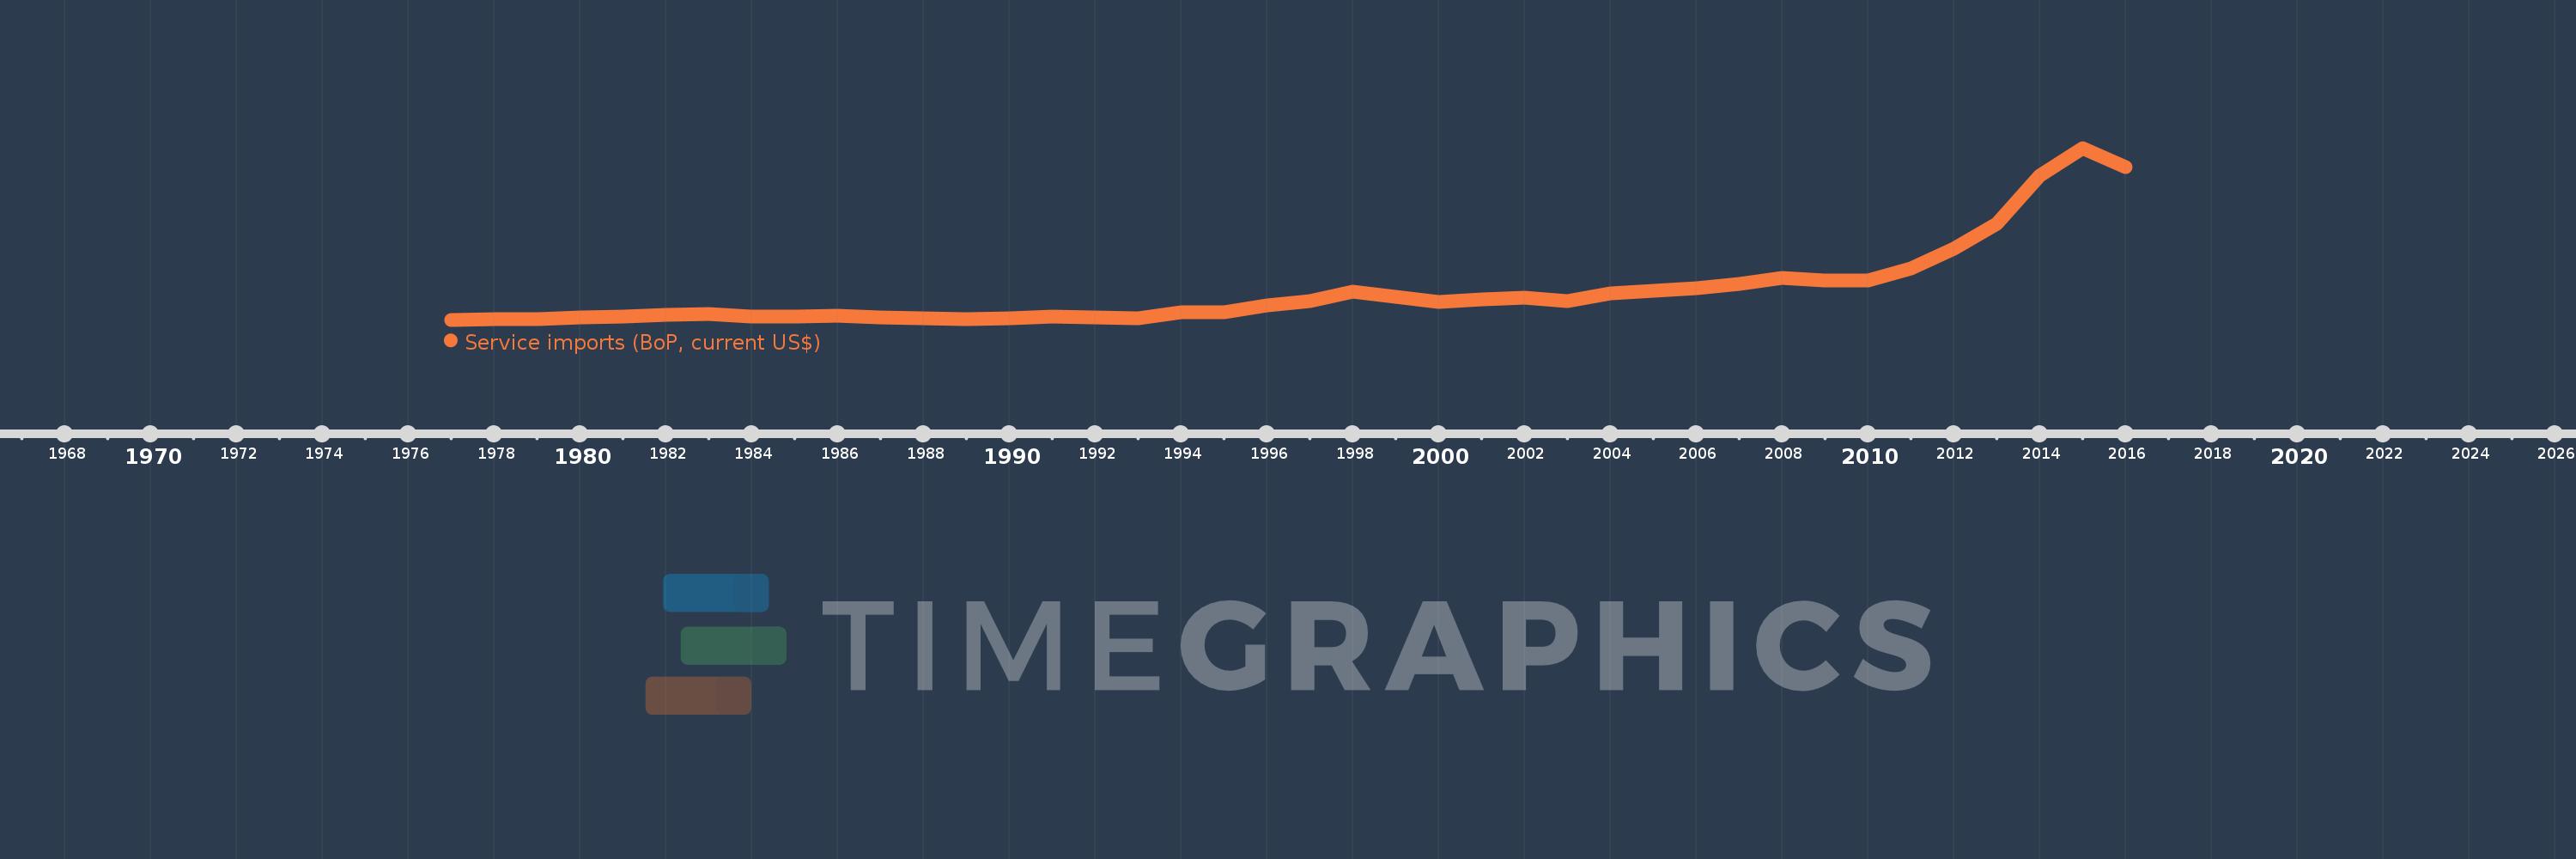
Service imports (BoP, current US$)
2016,2015,2014,2013,2012,2011,2010,2009,2008,2007,2006,2005,2004,2003,2002,2001,2000,1999,1998,1997,1996,1995,1994,1993,1992,1991,1990,1989,1988,1987,1986,1985,1984,1983,1982,1981,1980,1979,1978,1977
This statistics in other country:
AfghanistanAlbaniaAlgeriaAngolaAntigua and BarbudaArab WorldArgentinaArmeniaArubaAustraliaAustriaAzerbaijanBahamas, TheBahrainBangladeshBarbadosBelarusBelgiumBelizeBeninBermudaBhutanBoliviaBosnia and HerzegovinaBotswanaBrazilBrunei DarussalamBulgariaBurkina FasoBurundiCabo VerdeCambodiaCameroonCanadaCaribbean small statesCentral African RepublicCentral Europe and the BalticsChadChileChinaColombiaComorosCongo, Dem. Rep.Congo, Rep.Costa RicaCote d'IvoireCroatiaCuracaoCyprusCzech RepublicDenmarkDjiboutiDominicaDominican RepublicEarly-demographic dividendEast Asia & PacificEast Asia & Pacific (excluding high income)East Asia & Pacific (IDA & IBRD countries)EcuadorEgypt, Arab Rep.El SalvadorEquatorial GuineaEritreaEstoniaEthiopiaEuro areaEurope & Central AsiaEurope & Central Asia (excluding high income)Europe & Central Asia (IDA & IBRD countries)European UnionFaroe IslandsFijiFinlandFragile and conflict affected situationsFranceFrench PolynesiaGabonGambia, TheGeorgiaGermanyGhanaGreeceGrenadaGuatemalaGuineaGuinea-BissauGuyanaHaitiHeavily indebted poor countries (HIPC)High incomeHondurasHong Kong SAR, ChinaHungaryIBRD onlyIcelandIDA & IBRD totalIDA blendIDA onlyIDA totalIndiaIndonesiaIran, Islamic Rep.IraqIrelandIsraelItalyJamaicaJapanJordanKazakhstanKenyaKiribatiKorea, Rep.KosovoKuwaitKyrgyz RepublicLao PDRLate-demographic dividendLatin America & Caribbean Latin America & Caribbean (excluding high income)Latin America & the Caribbean (IDA & IBRD countries)LatviaLeast developed countries: UN classificationLebanonLesothoLiberiaLibyaLithuaniaLow & middle incomeLow incomeLower middle incomeLuxembourgMacao SAR, ChinaMacedonia, FYRMadagascarMalawiMalaysiaMaldivesMaliMaltaMarshall IslandsMauritaniaMauritiusMexicoMicronesia, Fed. Sts.Middle East & North Africa (excluding high income)Middle East & North Africa (IDA & IBRD countries)Middle incomeMoldovaMongoliaMontenegroMoroccoMozambiqueMyanmarNamibiaNepalNetherlandsNew CaledoniaNew ZealandNicaraguaNigerNigeriaNorth AmericaNorwayOECD membersOmanOther small statesPacific island small statesPakistanPalauPanamaPapua New GuineaParaguayPeruPhilippinesPolandPortugalPost-demographic dividendPre-demographic dividendQatarRomaniaRussian FederationRwandaSamoaSao Tome and PrincipeSaudi ArabiaSenegalSerbiaSeychellesSierra LeoneSingaporeSint Maarten (Dutch part)Slovak RepublicSloveniaSmall statesSolomon IslandsSouth AfricaSouth AsiaSouth Asia (IDA & IBRD)South SudanSpainSri LankaSt. Kitts and NevisSt. LuciaSt. Vincent and the GrenadinesSub-Saharan Africa Sub-Saharan Africa (excluding high income)Sub-Saharan Africa (IDA & IBRD countries)SudanSurinameSwazilandSwedenSwitzerlandSyrian Arab RepublicTajikistanTanzaniaThailandTimor-LesteTogoTongaTrinidad and TobagoTunisiaTurkeyTuvaluUgandaUkraineUnited KingdomUnited StatesUpper middle incomeUruguayVanuatuVenezuela, RBVietnamWest Bank and GazaWorldYemen, Rep.ZambiaZimbabwe Timeline:
This timeline shows a graph from 1977 to 2016 of Myanmar. No data until 1976. Number of actual observations by date: 40.
Source name:
World Development Indicators
Source organization:
International Monetary Fund, Balance of Payments Statistics Yearbook and data files.
Categories, topics:
Economy & Growth, Trade
Last updated:
apr 23, 2017
Indicators value changes by year
Minimum:
23.03 mln
jan 1, 1977
Maximum:
2.602 bln
jan 1, 2015
At the date of observation
Value
Absolute change
Change from previous value
jan 1, 1977
23.03 mln
+23.03 mln
0.0%
jan 1, 1978
31.465 mln
+8.436 mln
36.63%
jan 1, 1979
27.382 mln
-4.083 mln
-12.98%
jan 1, 1980
59.604 mln
+32.222 mln
117.68%
jan 1, 1981
74.017 mln
+14.413 mln
24.18%
jan 1, 1982
92.342 mln
+18.325 mln
24.76%
jan 1, 1983
106.685 mln
+14.343 mln
15.53%
jan 1, 1984
75.77 mln
-30.915 mln
-28.98%
jan 1, 1985
71.32 mln
-4.45 mln
-5.87%
jan 1, 1986
81.776 mln
+10.456 mln
14.66%
jan 1, 1987
56.792 mln
-24.984 mln
-30.55%
jan 1, 1988
46.785 mln
-10.008 mln
-17.62%
jan 1, 1989
34.468 mln
-12.317 mln
-26.33%
jan 1, 1990
44.255 mln
+9.788 mln
28.4%
jan 1, 1991
72.345 mln
+28.089 mln
63.47%
jan 1, 1992
54.347 mln
-17.998 mln
-24.88%
jan 1, 1993
42.416 mln
-11.931 mln
-21.95%
jan 1, 1994
130.225 mln
+87.809 mln
207.02%
jan 1, 1995
128.907 mln
-1.318 mln
-1.01%
jan 1, 1996
243.786 mln
+114.879 mln
89.12%
jan 1, 1997
301.951 mln
+58.165 mln
23.86%
jan 1, 1998
443.363 mln
+141.412 mln
46.83%
jan 1, 1999
364.797 mln
-78.566 mln
-17.72%
jan 1, 2000
288.226 mln
-76.571 mln
-20.99%
jan 1, 2001
323.673 mln
+35.447 mln
12.3%
jan 1, 2002
357.733 mln
+34.06 mln
10.52%
jan 1, 2003
306.281 mln
-51.452 mln
-14.38%
jan 1, 2004
415.696 mln
+109.415 mln
35.72%
jan 1, 2005
454.872 mln
+39.177 mln
9.42%
jan 1, 2006
497.092 mln
+42.22 mln
9.28%
jan 1, 2007
557.147 mln
+60.055 mln
12.08%
jan 1, 2008
653.114 mln
+95.966 mln
17.22%
jan 1, 2009
617.237 mln
-35.877 mln
-5.49%
jan 1, 2010
617.233 mln
-3.365K
0.0%
jan 1, 2011
789.024 mln
+171.791 mln
27.83%
jan 1, 2012
1.09 bln
+301.191 mln
38.17%
jan 1, 2013
1.459 bln
+369.125 mln
33.86%
jan 1, 2014
2.187 bln
+727.937 mln
49.88%
jan 1, 2015
2.602 bln
+414.994 mln
18.97%
jan 1, 2016
2.312 bln
-289.783 mln
-11.14%
Ranking of countries by current statistics by years


Comments: