29
/
en
AIzaSyAYiBZKx7MnpbEhh9jyipgxe19OcubqV5w
April 1, 2024
221555
Paraguay
PRY
true
2
1
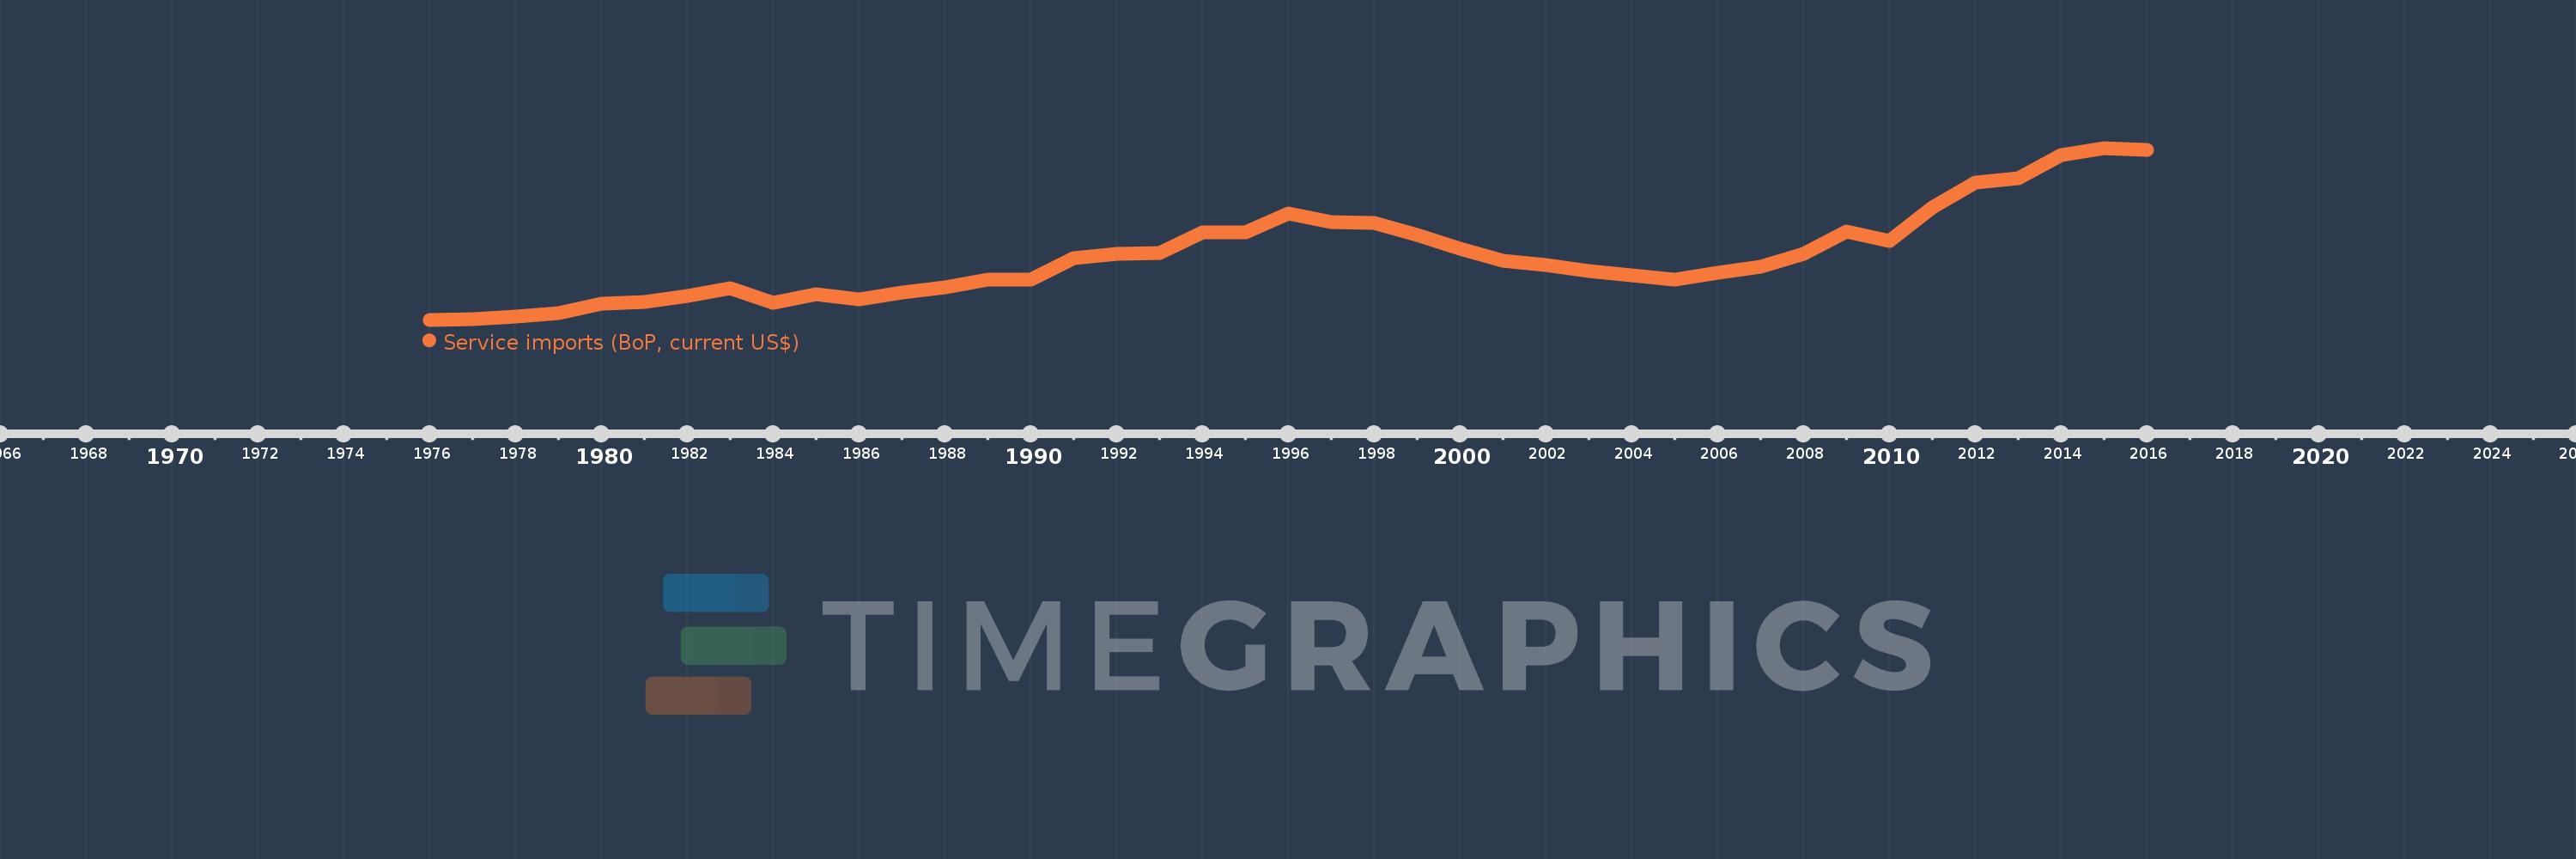
Service imports (BoP, current US$)
2016,2015,2014,2013,2012,2011,2010,2009,2008,2007,2006,2005,2004,2003,2002,2001,2000,1999,1998,1997,1996,1995,1994,1993,1992,1991,1990,1989,1988,1987,1986,1985,1984,1983,1982,1981,1980,1979,1978,1977,1976
This statistics in other country:
AfghanistanAlbaniaAlgeriaAngolaAntigua and BarbudaArab WorldArgentinaArmeniaArubaAustraliaAustriaAzerbaijanBahamas, TheBahrainBangladeshBarbadosBelarusBelgiumBelizeBeninBermudaBhutanBoliviaBosnia and HerzegovinaBotswanaBrazilBrunei DarussalamBulgariaBurkina FasoBurundiCabo VerdeCambodiaCameroonCanadaCaribbean small statesCentral African RepublicCentral Europe and the BalticsChadChileChinaColombiaComorosCongo, Dem. Rep.Congo, Rep.Costa RicaCote d'IvoireCroatiaCuracaoCyprusCzech RepublicDenmarkDjiboutiDominicaDominican RepublicEarly-demographic dividendEast Asia & PacificEast Asia & Pacific (excluding high income)East Asia & Pacific (IDA & IBRD countries)EcuadorEgypt, Arab Rep.El SalvadorEquatorial GuineaEritreaEstoniaEthiopiaEuro areaEurope & Central AsiaEurope & Central Asia (excluding high income)Europe & Central Asia (IDA & IBRD countries)European UnionFaroe IslandsFijiFinlandFragile and conflict affected situationsFranceFrench PolynesiaGabonGambia, TheGeorgiaGermanyGhanaGreeceGrenadaGuatemalaGuineaGuinea-BissauGuyanaHaitiHeavily indebted poor countries (HIPC)High incomeHondurasHong Kong SAR, ChinaHungaryIBRD onlyIcelandIDA & IBRD totalIDA blendIDA onlyIDA totalIndiaIndonesiaIran, Islamic Rep.IraqIrelandIsraelItalyJamaicaJapanJordanKazakhstanKenyaKiribatiKorea, Rep.KosovoKuwaitKyrgyz RepublicLao PDRLate-demographic dividendLatin America & Caribbean Latin America & Caribbean (excluding high income)Latin America & the Caribbean (IDA & IBRD countries)LatviaLeast developed countries: UN classificationLebanonLesothoLiberiaLibyaLithuaniaLow & middle incomeLow incomeLower middle incomeLuxembourgMacao SAR, ChinaMacedonia, FYRMadagascarMalawiMalaysiaMaldivesMaliMaltaMarshall IslandsMauritaniaMauritiusMexicoMicronesia, Fed. Sts.Middle East & North Africa (excluding high income)Middle East & North Africa (IDA & IBRD countries)Middle incomeMoldovaMongoliaMontenegroMoroccoMozambiqueMyanmarNamibiaNepalNetherlandsNew CaledoniaNew ZealandNicaraguaNigerNigeriaNorth AmericaNorwayOECD membersOmanOther small statesPacific island small statesPakistanPalauPanamaPapua New GuineaParaguayPeruPhilippinesPolandPortugalPost-demographic dividendPre-demographic dividendQatarRomaniaRussian FederationRwandaSamoaSao Tome and PrincipeSaudi ArabiaSenegalSerbiaSeychellesSierra LeoneSingaporeSint Maarten (Dutch part)Slovak RepublicSloveniaSmall statesSolomon IslandsSouth AfricaSouth AsiaSouth Asia (IDA & IBRD)South SudanSpainSri LankaSt. Kitts and NevisSt. LuciaSt. Vincent and the GrenadinesSub-Saharan Africa Sub-Saharan Africa (excluding high income)Sub-Saharan Africa (IDA & IBRD countries)SudanSurinameSwazilandSwedenSwitzerlandSyrian Arab RepublicTajikistanTanzaniaThailandTimor-LesteTogoTongaTrinidad and TobagoTunisiaTurkeyTuvaluUgandaUkraineUnited KingdomUnited StatesUpper middle incomeUruguayVanuatuVenezuela, RBVietnamWest Bank and GazaWorldYemen, Rep.ZambiaZimbabwe Timeline:
This timeline shows a graph from 1976 to 2016 of Paraguay. No data until 1975. Number of actual observations by date: 41.
Source name:
World Development Indicators
Source organization:
International Monetary Fund, Balance of Payments Statistics Yearbook and data files.
Categories, topics:
Economy & Growth, Trade
Last updated:
apr 23, 2017
Indicators value changes by year
Minimum:
55.1 mln
jan 1, 1976
Maximum:
1.115 bln
jan 1, 2015
At the date of observation
Value
Absolute change
Change from previous value
jan 1, 1976
55.1 mln
+55.1 mln
0.0%
jan 1, 1977
57.8 mln
+2.7 mln
4.9%
jan 1, 1978
72.1 mln
+14.3 mln
24.74%
jan 1, 1979
95.6 mln
+23.5 mln
32.59%
jan 1, 1980
154.2 mln
+58.6 mln
61.3%
jan 1, 1981
165.1 mln
+10.9 mln
7.07%
jan 1, 1982
203.9 mln
+38.8 mln
23.5%
jan 1, 1983
250.3 mln
+46.4 mln
22.76%
jan 1, 1984
157.4 mln
-92.9 mln
-37.12%
jan 1, 1985
211.9 mln
+54.5 mln
34.63%
jan 1, 1986
180.3 mln
-31.6 mln
-14.91%
jan 1, 1987
224.9 mln
+44.6 mln
24.74%
jan 1, 1988
256.3 mln
+31.4 mln
13.96%
jan 1, 1989
300.8 mln
+44.5 mln
17.36%
jan 1, 1990
303.5 mln
+2.7 mln
0.9%
jan 1, 1991
434.2 mln
+130.7 mln
43.06%
jan 1, 1992
460.3 mln
+26.1 mln
6.01%
jan 1, 1993
464.5 mln
+4.2 mln
0.91%
jan 1, 1994
592.8 mln
+128.3 mln
27.62%
jan 1, 1995
593.4 mln
+600.0K
0.1%
jan 1, 1996
710.7 mln
+117.3 mln
19.77%
jan 1, 1997
658.8 mln
-51.9 mln
-7.3%
jan 1, 1998
654.6 mln
-4.2 mln
-0.64%
jan 1, 1999
575.9 mln
-78.7 mln
-12.02%
jan 1, 2000
493.8 mln
-82.1 mln
-14.26%
jan 1, 2001
420.76 mln
-73.04 mln
-14.79%
jan 1, 2002
390.69 mln
-30.07 mln
-7.15%
jan 1, 2003
355.29 mln
-35.4 mln
-9.06%
jan 1, 2004
329.346 mln
-25.944 mln
-7.3%
jan 1, 2005
301.7 mln
-27.646 mln
-8.39%
jan 1, 2006
344.108 mln
+42.408 mln
14.06%
jan 1, 2007
384.544 mln
+40.436 mln
11.75%
jan 1, 2008
464.022 mln
+79.478 mln
20.67%
jan 1, 2009
598.528 mln
+134.505 mln
28.99%
jan 1, 2010
541.217 mln
-57.311 mln
-9.58%
jan 1, 2011
747.445 mln
+206.229 mln
38.1%
jan 1, 2012
903.666 mln
+156.221 mln
20.9%
jan 1, 2013
927.346 mln
+23.68 mln
2.62%
jan 1, 2014
1.069 bln
+141.381 mln
15.25%
jan 1, 2015
1.115 bln
+46.004 mln
4.3%
jan 1, 2016
1.105 bln
-10.094 mln
-0.91%
Ranking of countries by current statistics by years


Comments: