29
/
en
AIzaSyAYiBZKx7MnpbEhh9jyipgxe19OcubqV5w
April 1, 2024
277125
United States
USA
true
2
1
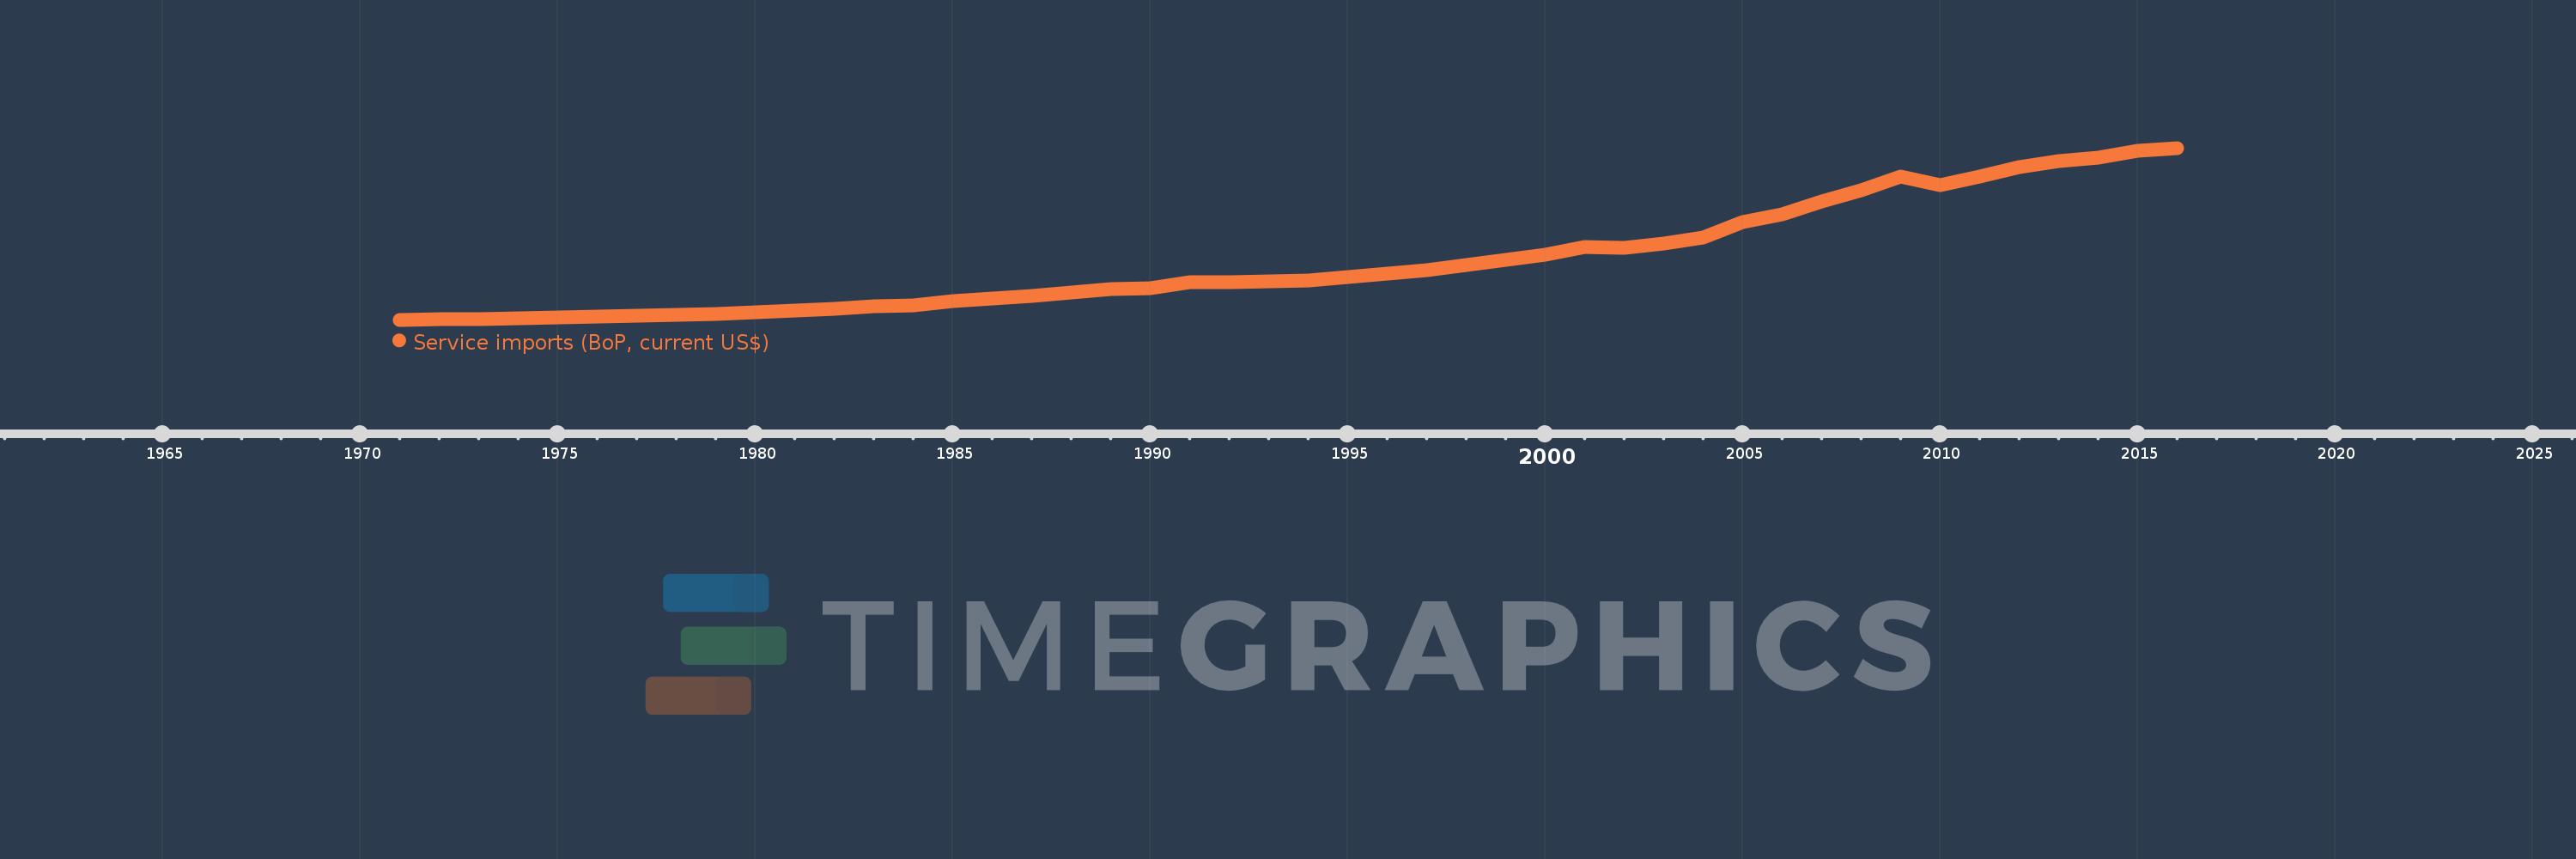
Service imports (BoP, current US$)
2016,2015,2014,2013,2012,2011,2010,2009,2008,2007,2006,2005,2004,2003,2002,2001,2000,1999,1998,1997,1996,1995,1994,1993,1992,1991,1990,1989,1988,1987,1986,1985,1984,1983,1982,1981,1980,1979,1978,1977,1976,1975,1974,1973,1972,1971
This statistics in other country:
AfghanistanAlbaniaAlgeriaAngolaAntigua and BarbudaArab WorldArgentinaArmeniaArubaAustraliaAustriaAzerbaijanBahamas, TheBahrainBangladeshBarbadosBelarusBelgiumBelizeBeninBermudaBhutanBoliviaBosnia and HerzegovinaBotswanaBrazilBrunei DarussalamBulgariaBurkina FasoBurundiCabo VerdeCambodiaCameroonCanadaCaribbean small statesCentral African RepublicCentral Europe and the BalticsChadChileChinaColombiaComorosCongo, Dem. Rep.Congo, Rep.Costa RicaCote d'IvoireCroatiaCuracaoCyprusCzech RepublicDenmarkDjiboutiDominicaDominican RepublicEarly-demographic dividendEast Asia & PacificEast Asia & Pacific (excluding high income)East Asia & Pacific (IDA & IBRD countries)EcuadorEgypt, Arab Rep.El SalvadorEquatorial GuineaEritreaEstoniaEthiopiaEuro areaEurope & Central AsiaEurope & Central Asia (excluding high income)Europe & Central Asia (IDA & IBRD countries)European UnionFaroe IslandsFijiFinlandFragile and conflict affected situationsFranceFrench PolynesiaGabonGambia, TheGeorgiaGermanyGhanaGreeceGrenadaGuatemalaGuineaGuinea-BissauGuyanaHaitiHeavily indebted poor countries (HIPC)High incomeHondurasHong Kong SAR, ChinaHungaryIBRD onlyIcelandIDA & IBRD totalIDA blendIDA onlyIDA totalIndiaIndonesiaIran, Islamic Rep.IraqIrelandIsraelItalyJamaicaJapanJordanKazakhstanKenyaKiribatiKorea, Rep.KosovoKuwaitKyrgyz RepublicLao PDRLate-demographic dividendLatin America & Caribbean Latin America & Caribbean (excluding high income)Latin America & the Caribbean (IDA & IBRD countries)LatviaLeast developed countries: UN classificationLebanonLesothoLiberiaLibyaLithuaniaLow & middle incomeLow incomeLower middle incomeLuxembourgMacao SAR, ChinaMacedonia, FYRMadagascarMalawiMalaysiaMaldivesMaliMaltaMarshall IslandsMauritaniaMauritiusMexicoMicronesia, Fed. Sts.Middle East & North Africa (excluding high income)Middle East & North Africa (IDA & IBRD countries)Middle incomeMoldovaMongoliaMontenegroMoroccoMozambiqueMyanmarNamibiaNepalNetherlandsNew CaledoniaNew ZealandNicaraguaNigerNigeriaNorth AmericaNorwayOECD membersOmanOther small statesPacific island small statesPakistanPalauPanamaPapua New GuineaParaguayPeruPhilippinesPolandPortugalPost-demographic dividendPre-demographic dividendQatarRomaniaRussian FederationRwandaSamoaSao Tome and PrincipeSaudi ArabiaSenegalSerbiaSeychellesSierra LeoneSingaporeSint Maarten (Dutch part)Slovak RepublicSloveniaSmall statesSolomon IslandsSouth AfricaSouth AsiaSouth Asia (IDA & IBRD)South SudanSpainSri LankaSt. Kitts and NevisSt. LuciaSt. Vincent and the GrenadinesSub-Saharan Africa Sub-Saharan Africa (excluding high income)Sub-Saharan Africa (IDA & IBRD countries)SudanSurinameSwazilandSwedenSwitzerlandSyrian Arab RepublicTajikistanTanzaniaThailandTimor-LesteTogoTongaTrinidad and TobagoTunisiaTurkeyTuvaluUgandaUkraineUnited KingdomUnited StatesUpper middle incomeUruguayVanuatuVenezuela, RBVietnamWest Bank and GazaWorldYemen, Rep.ZambiaZimbabwe Timeline:
This timeline shows a graph from 1971 to 2016 of United States. No data until 1970. Number of actual observations by date: 46.
Source name:
World Development Indicators
Source organization:
International Monetary Fund, Balance of Payments Statistics Yearbook and data files.
Categories, topics:
Economy & Growth, Trade
Last updated:
apr 23, 2017
Indicators value changes by year
Minimum:
14.65 bln
jan 1, 1971
Maximum:
488.651 bln
jan 1, 2016
At the date of observation
Value
Absolute change
Change from previous value
jan 1, 1971
14.65 bln
+14.65 bln
0.0%
jan 1, 1972
15.57 bln
+920.0 mln
6.28%
jan 1, 1973
17.05 bln
+1.48 bln
9.51%
jan 1, 1974
19.09 bln
+2.04 bln
11.96%
jan 1, 1975
21.66 bln
+2.57 bln
13.46%
jan 1, 1976
22.27 bln
+610.0 mln
2.82%
jan 1, 1977
24.91 bln
+2.64 bln
11.85%
jan 1, 1978
27.63 bln
+2.72 bln
10.92%
jan 1, 1979
31.69 bln
+4.06 bln
14.69%
jan 1, 1980
36.23 bln
+4.54 bln
14.33%
jan 1, 1981
40.97 bln
+4.74 bln
13.08%
jan 1, 1982
44.88 bln
+3.91 bln
9.54%
jan 1, 1983
51.04 bln
+6.16 bln
13.73%
jan 1, 1984
54.26 bln
+3.22 bln
6.31%
jan 1, 1985
66.91 bln
+12.65 bln
23.31%
jan 1, 1986
72.03 bln
+5.12 bln
7.65%
jan 1, 1987
80.158 bln
+8.128 bln
11.28%
jan 1, 1988
90.786 bln
+10.628 bln
13.26%
jan 1, 1989
98.615 bln
+7.829 bln
8.62%
jan 1, 1990
102.51 bln
+3.895 bln
3.95%
jan 1, 1991
117.67 bln
+15.16 bln
14.79%
jan 1, 1992
118.5 bln
+830.0 mln
0.71%
jan 1, 1993
119.552 bln
+1.052 bln
0.89%
jan 1, 1994
123.771 bln
+4.219 bln
3.53%
jan 1, 1995
133.075 bln
+9.304 bln
7.52%
jan 1, 1996
141.41 bln
+8.335 bln
6.26%
jan 1, 1997
152.55 bln
+11.14 bln
7.88%
jan 1, 1998
165.953 bln
+13.403 bln
8.79%
jan 1, 1999
180.676 bln
+14.723 bln
8.87%
jan 1, 2000
192.898 bln
+12.222 bln
6.76%
jan 1, 2001
216.121 bln
+23.223 bln
12.04%
jan 1, 2002
213.469 bln
-2.652 bln
-1.23%
jan 1, 2003
224.381 bln
+10.912 bln
5.11%
jan 1, 2004
242.221 bln
+17.84 bln
7.95%
jan 1, 2005
283.082 bln
+40.861 bln
16.87%
jan 1, 2006
304.451 bln
+21.369 bln
7.55%
jan 1, 2007
341.167 bln
+36.716 bln
12.06%
jan 1, 2008
372.573 bln
+31.406 bln
9.21%
jan 1, 2009
409.055 bln
+36.482 bln
9.79%
jan 1, 2010
386.803 bln
-22.252 bln
-5.44%
jan 1, 2011
409.311 bln
+22.508 bln
5.82%
jan 1, 2012
435.764 bln
+26.453 bln
6.46%
jan 1, 2013
452.012 bln
+16.248 bln
3.73%
jan 1, 2014
461.083 bln
+9.071 bln
2.01%
jan 1, 2015
481.268 bln
+20.185 bln
4.38%
jan 1, 2016
488.651 bln
+7.383 bln
1.53%
Ranking of countries by current statistics by years


Comments: