29
/
en
AIzaSyAYiBZKx7MnpbEhh9jyipgxe19OcubqV5w
April 1, 2024
163270
Jamaica
JAM
true
2
1
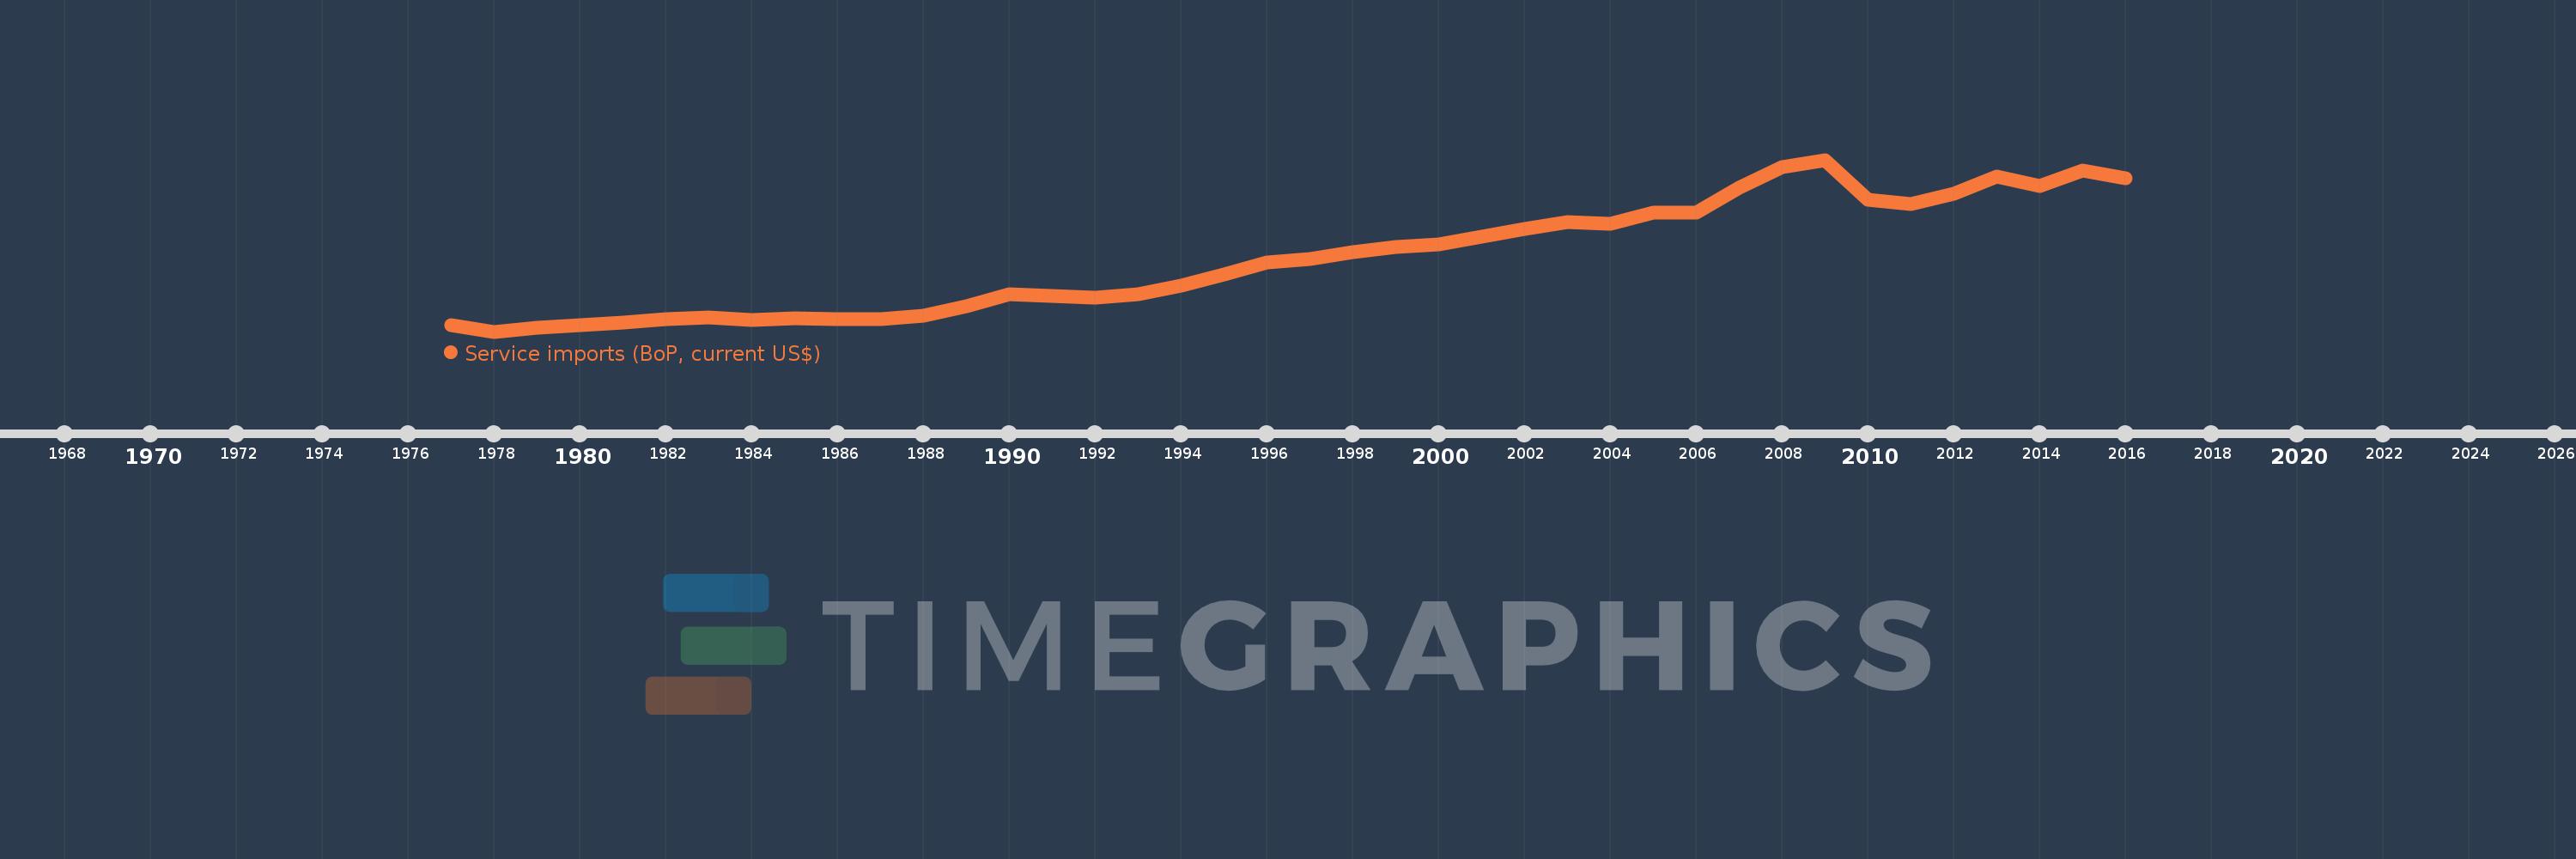
Service imports (BoP, current US$)
2016,2015,2014,2013,2012,2011,2010,2009,2008,2007,2006,2005,2004,2003,2002,2001,2000,1999,1998,1997,1996,1995,1994,1993,1992,1991,1990,1989,1988,1987,1986,1985,1984,1983,1982,1981,1980,1979,1978,1977
This statistics in other country:
AfghanistanAlbaniaAlgeriaAngolaAntigua and BarbudaArab WorldArgentinaArmeniaArubaAustraliaAustriaAzerbaijanBahamas, TheBahrainBangladeshBarbadosBelarusBelgiumBelizeBeninBermudaBhutanBoliviaBosnia and HerzegovinaBotswanaBrazilBrunei DarussalamBulgariaBurkina FasoBurundiCabo VerdeCambodiaCameroonCanadaCaribbean small statesCentral African RepublicCentral Europe and the BalticsChadChileChinaColombiaComorosCongo, Dem. Rep.Congo, Rep.Costa RicaCote d'IvoireCroatiaCuracaoCyprusCzech RepublicDenmarkDjiboutiDominicaDominican RepublicEarly-demographic dividendEast Asia & PacificEast Asia & Pacific (excluding high income)East Asia & Pacific (IDA & IBRD countries)EcuadorEgypt, Arab Rep.El SalvadorEquatorial GuineaEritreaEstoniaEthiopiaEuro areaEurope & Central AsiaEurope & Central Asia (excluding high income)Europe & Central Asia (IDA & IBRD countries)European UnionFaroe IslandsFijiFinlandFragile and conflict affected situationsFranceFrench PolynesiaGabonGambia, TheGeorgiaGermanyGhanaGreeceGrenadaGuatemalaGuineaGuinea-BissauGuyanaHaitiHeavily indebted poor countries (HIPC)High incomeHondurasHong Kong SAR, ChinaHungaryIBRD onlyIcelandIDA & IBRD totalIDA blendIDA onlyIDA totalIndiaIndonesiaIran, Islamic Rep.IraqIrelandIsraelItalyJamaicaJapanJordanKazakhstanKenyaKiribatiKorea, Rep.KosovoKuwaitKyrgyz RepublicLao PDRLate-demographic dividendLatin America & Caribbean Latin America & Caribbean (excluding high income)Latin America & the Caribbean (IDA & IBRD countries)LatviaLeast developed countries: UN classificationLebanonLesothoLiberiaLibyaLithuaniaLow & middle incomeLow incomeLower middle incomeLuxembourgMacao SAR, ChinaMacedonia, FYRMadagascarMalawiMalaysiaMaldivesMaliMaltaMarshall IslandsMauritaniaMauritiusMexicoMicronesia, Fed. Sts.Middle East & North Africa (excluding high income)Middle East & North Africa (IDA & IBRD countries)Middle incomeMoldovaMongoliaMontenegroMoroccoMozambiqueMyanmarNamibiaNepalNetherlandsNew CaledoniaNew ZealandNicaraguaNigerNigeriaNorth AmericaNorwayOECD membersOmanOther small statesPacific island small statesPakistanPalauPanamaPapua New GuineaParaguayPeruPhilippinesPolandPortugalPost-demographic dividendPre-demographic dividendQatarRomaniaRussian FederationRwandaSamoaSao Tome and PrincipeSaudi ArabiaSenegalSerbiaSeychellesSierra LeoneSingaporeSint Maarten (Dutch part)Slovak RepublicSloveniaSmall statesSolomon IslandsSouth AfricaSouth AsiaSouth Asia (IDA & IBRD)South SudanSpainSri LankaSt. Kitts and NevisSt. LuciaSt. Vincent and the GrenadinesSub-Saharan Africa Sub-Saharan Africa (excluding high income)Sub-Saharan Africa (IDA & IBRD countries)SudanSurinameSwazilandSwedenSwitzerlandSyrian Arab RepublicTajikistanTanzaniaThailandTimor-LesteTogoTongaTrinidad and TobagoTunisiaTurkeyTuvaluUgandaUkraineUnited KingdomUnited StatesUpper middle incomeUruguayVanuatuVenezuela, RBVietnamWest Bank and GazaWorldYemen, Rep.ZambiaZimbabwe Timeline:
This timeline shows a graph from 1977 to 2016 of Jamaica. No data until 1976. Number of actual observations by date: 40.
Source name:
World Development Indicators
Source organization:
International Monetary Fund, Balance of Payments Statistics Yearbook and data files.
Categories, topics:
Economy & Growth, Trade
Last updated:
apr 23, 2017
Indicators value changes by year
Minimum:
257.0 mln
jan 1, 1978
Maximum:
2.367 bln
jan 1, 2009
At the date of observation
Value
Absolute change
Change from previous value
jan 1, 1977
332.8 mln
+332.8 mln
0.0%
jan 1, 1978
257.0 mln
-75.8 mln
-22.78%
jan 1, 1979
299.7 mln
+42.7 mln
16.61%
jan 1, 1980
339.5 mln
+39.8 mln
13.28%
jan 1, 1981
369.9 mln
+30.4 mln
8.95%
jan 1, 1982
407.1 mln
+37.2 mln
10.06%
jan 1, 1983
430.0 mln
+22.9 mln
5.63%
jan 1, 1984
403.3 mln
-26.7 mln
-6.21%
jan 1, 1985
418.0 mln
+14.7 mln
3.64%
jan 1, 1986
414.9 mln
-3.1 mln
-0.74%
jan 1, 1987
411.4 mln
-3.5 mln
-0.84%
jan 1, 1988
455.0 mln
+43.6 mln
10.6%
jan 1, 1989
567.6 mln
+112.6 mln
24.75%
jan 1, 1990
720.8 mln
+153.2 mln
26.99%
jan 1, 1991
697.4 mln
-23.4 mln
-3.25%
jan 1, 1992
670.3 mln
-27.1 mln
-3.89%
jan 1, 1993
714.4 mln
+44.1 mln
6.58%
jan 1, 1994
823.5 mln
+109.1 mln
15.27%
jan 1, 1995
955.3 mln
+131.8 mln
16.0%
jan 1, 1996
1.104 bln
+148.5 mln
15.54%
jan 1, 1997
1.149 bln
+45.4 mln
4.11%
jan 1, 1998
1.232 bln
+82.5 mln
7.18%
jan 1, 1999
1.294 bln
+61.9 mln
5.03%
jan 1, 2000
1.323 bln
+29.4 mln
2.27%
jan 1, 2001
1.423 bln
+99.5 mln
7.52%
jan 1, 2002
1.514 bln
+91.4 mln
6.43%
jan 1, 2003
1.597 bln
+83.495 mln
5.52%
jan 1, 2004
1.586 bln
-11.253 mln
-0.7%
jan 1, 2005
1.719 bln
+132.549 mln
8.36%
jan 1, 2006
1.722 bln
+3.337 mln
0.19%
jan 1, 2007
2.021 bln
+299.035 mln
17.37%
jan 1, 2008
2.282 bln
+260.619 mln
12.9%
jan 1, 2009
2.367 bln
+85.434 mln
3.74%
jan 1, 2010
1.881 bln
-486.48 mln
-20.55%
jan 1, 2011
1.824 bln
-56.237 mln
-2.99%
jan 1, 2012
1.946 bln
+121.641 mln
6.67%
jan 1, 2013
2.163 bln
+216.489 mln
11.12%
jan 1, 2014
2.042 bln
-120.513 mln
-5.57%
jan 1, 2015
2.233 bln
+191.232 mln
9.36%
jan 1, 2016
2.137 bln
-96.157 mln
-4.31%
Ranking of countries by current statistics by years


Comments: