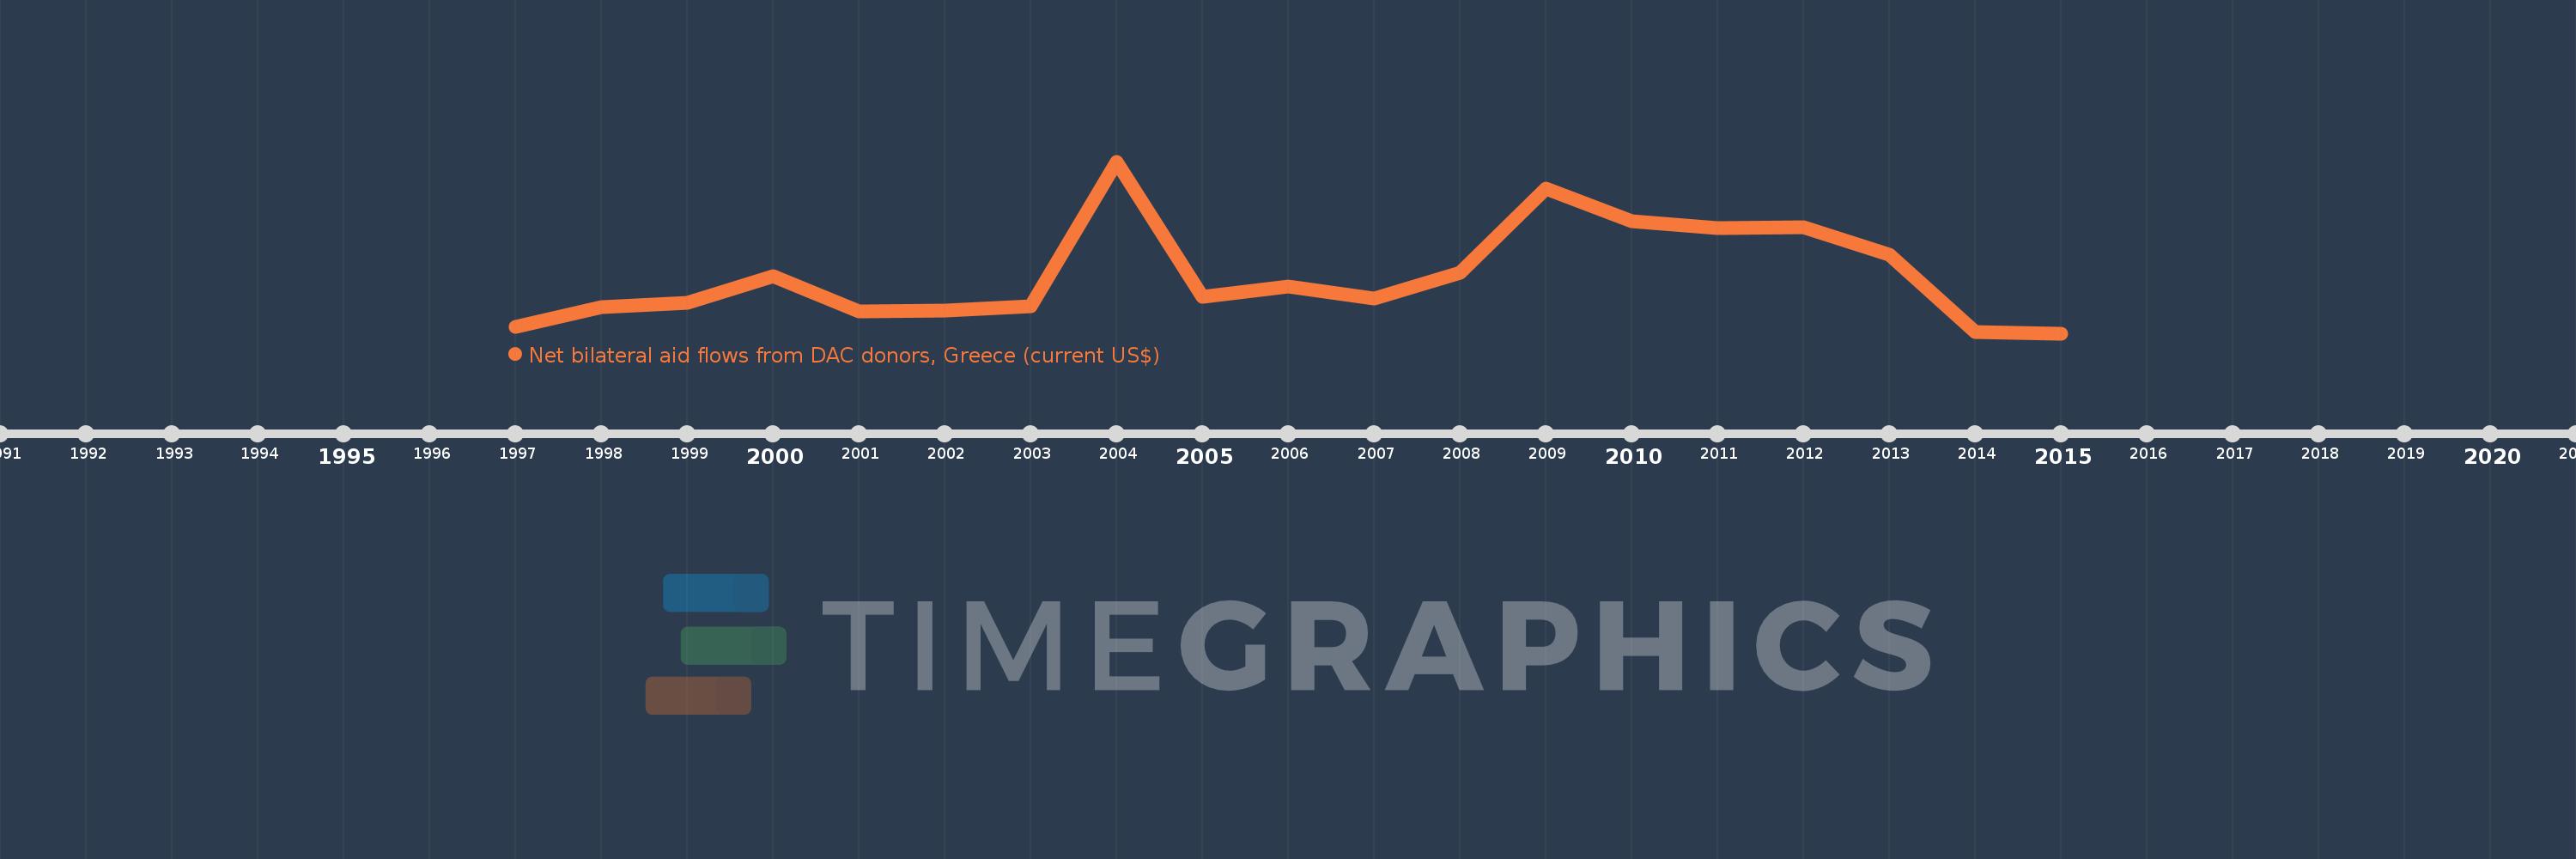
This timeline shows a graph from 1997 to 2015 of Albania. No data until 1996. Number of actual observations by date: 19.
Source name:
World Development Indicators
Source organization:
Development Assistance Committee of the Organisation for Economic Co-operation and Development, Geographical Distribution of Financial Flows to Developing Countries, Development Co-operation Report, and International Development Statistics database. Data are available online at: www.oecd.org/dac/stats/idsonline.
Categories, topics:
Aid Effectiveness
Last updated:
apr 23, 2017
Indicators value changes by year
Meaning:
29.066 mln
Minimum:
1.75 mln
jan 1, 2015
Maximum:
83.38 mln
jan 1, 2004
At the date of observation
Value
Absolute change
Change from the previous value
jan 1, 1997
4.83 mln
+4.83 mln
0.0%
jan 1, 1998
14.4 mln
+9.57 mln
198.14%
jan 1, 1999
16.16 mln
+1.76 mln
12.22%
jan 1, 2000
28.98 mln
+12.82 mln
79.33%
jan 1, 2001
12.33 mln
-16.65 mln
-57.45%
jan 1, 2002
12.49 mln
+160.0K
1.3%
jan 1, 2003
14.74 mln
+2.25 mln
18.01%
jan 1, 2004
83.38 mln
+68.64 mln
465.67%
jan 1, 2005
19.2 mln
-64.18 mln
-76.97%
jan 1, 2006
24.12 mln
+4.92 mln
25.63%
jan 1, 2007
18.32 mln
-5.8 mln
-24.05%
jan 1, 2008
30.62 mln
+12.3 mln
67.14%
jan 1, 2009
70.46 mln
+39.84 mln
130.11%
jan 1, 2010
54.99 mln
-15.47 mln
-21.96%
jan 1, 2011
51.93 mln
-3.06 mln
-5.56%
jan 1, 2012
51.97 mln
+40.0K
0.08%
jan 1, 2013
39.24 mln
-12.73 mln
-24.49%
jan 1, 2014
2.34 mln
-36.9 mln
-94.04%
jan 1, 2015
1.75 mln
-590.0K
-25.21%
Ranking of countries by current statistics by years