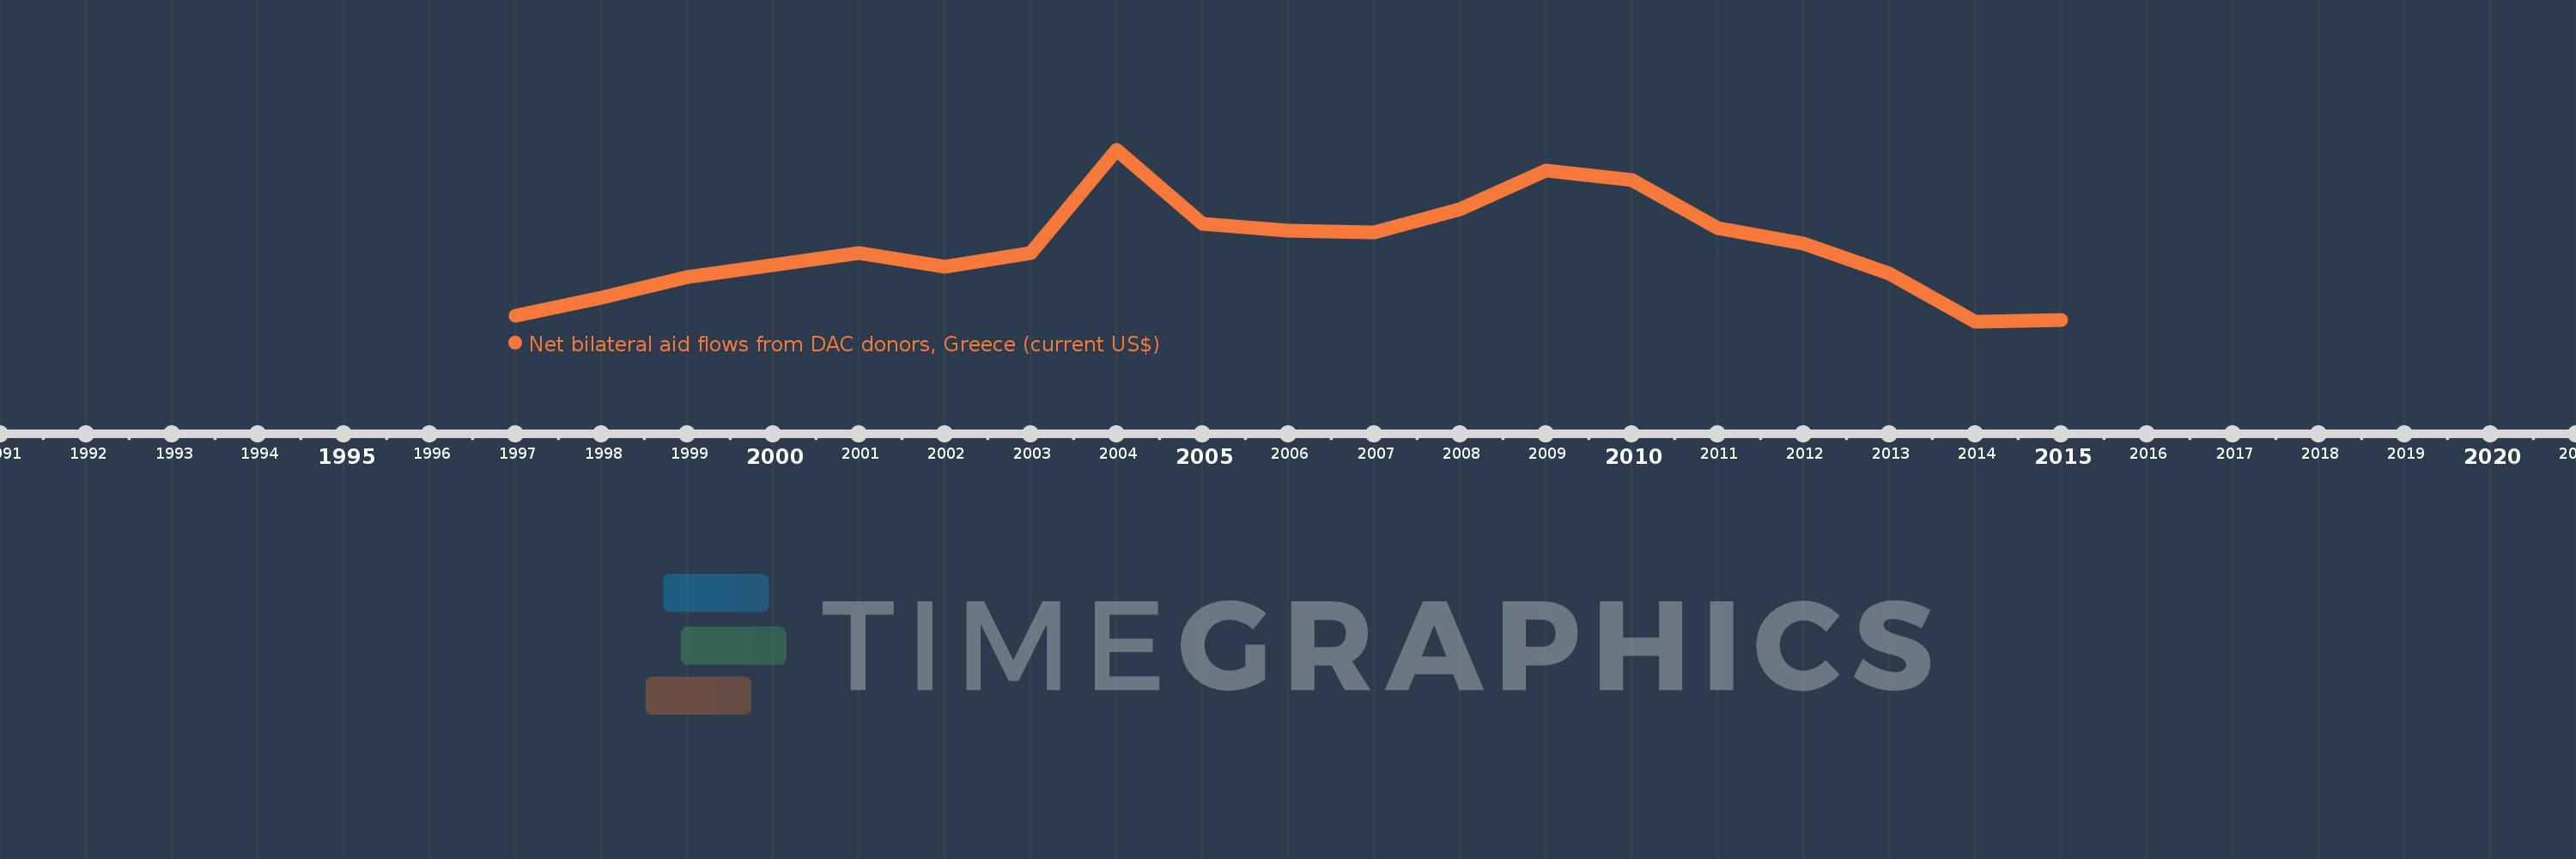
This timeline shows a graph from 1997 to 2015 of Middle income. No data until 1996. Number of actual observations by date: 19.
Source name:
World Development Indicators
Source organization:
Development Assistance Committee of the Organisation for Economic Co-operation and Development, Geographical Distribution of Financial Flows to Developing Countries, Development Co-operation Report, and International Development Statistics database. Data are available online at: www.oecd.org/dac/stats/idsonline.
Categories, topics:
Aid Effectiveness
Last updated:
apr 23, 2017
Indicators value changes by year
Meaning:
104.259 mln
Minimum:
12.3 mln
jan 1, 2014
Maximum:
225.82 mln
jan 1, 2004
At the date of observation
Value
Absolute change
Change from the previous value
jan 1, 1997
20.06 mln
+20.06 mln
0.0%
jan 1, 1998
42.65 mln
+22.59 mln
112.61%
jan 1, 1999
68.18 mln
+25.53 mln
59.86%
jan 1, 2000
82.85 mln
+14.67 mln
21.52%
jan 1, 2001
98.5 mln
+15.65 mln
18.89%
jan 1, 2002
80.68 mln
-17.82 mln
-18.09%
jan 1, 2003
97.64 mln
+16.96 mln
21.02%
jan 1, 2004
225.82 mln
+128.18 mln
131.28%
jan 1, 2005
134.67 mln
-91.15 mln
-40.36%
jan 1, 2006
126.25 mln
-8.42 mln
-6.25%
jan 1, 2007
124.13 mln
-2.12 mln
-1.68%
jan 1, 2008
152.16 mln
+28.03 mln
22.58%
jan 1, 2009
200.96 mln
+48.8 mln
32.07%
jan 1, 2010
189.25 mln
-11.71 mln
-5.83%
jan 1, 2011
129.0 mln
-60.25 mln
-31.84%
jan 1, 2012
109.45 mln
-19.55 mln
-15.16%
jan 1, 2013
71.89 mln
-37.56 mln
-34.32%
jan 1, 2014
12.3 mln
-59.59 mln
-82.89%
jan 1, 2015
14.48 mln
+2.18 mln
17.72%
Ranking of countries by current statistics by years