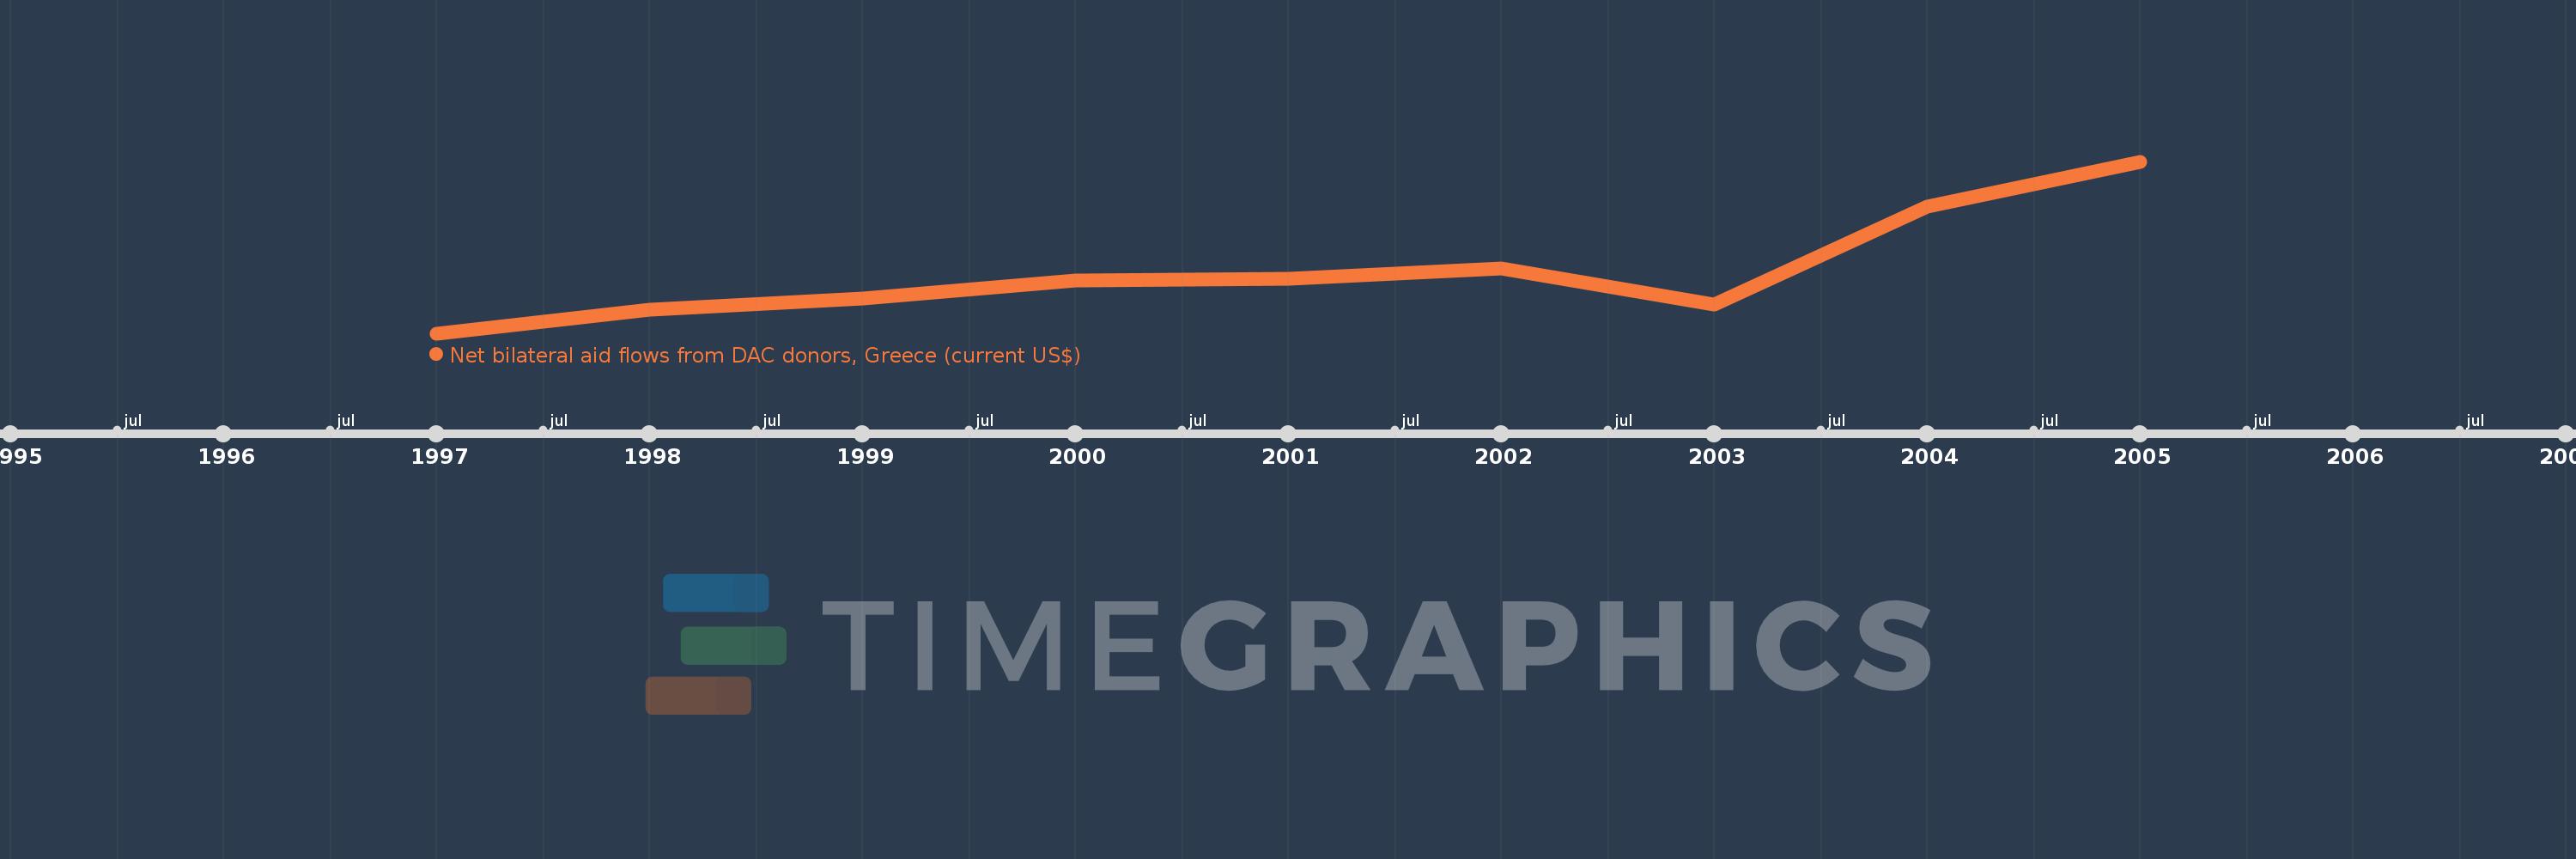
This timeline shows a graph from 1997 to 2005 of Romania. No data until 1996. Number of actual observations by date: 9.
Source name:
World Development Indicators
Source organization:
Development Assistance Committee of the Organisation for Economic Co-operation and Development, Geographical Distribution of Financial Flows to Developing Countries, Development Co-operation Report, and International Development Statistics database. Data are available online at: www.oecd.org/dac/stats/idsonline.
Categories, topics:
Aid Effectiveness
Last updated:
apr 23, 2017
Indicators value changes by year
Meaning:
1.979 mln
Minimum:
90.0K
jan 1, 1997
Maximum:
5.32 mln
jan 1, 2005
At the date of observation
Value
Absolute change
Change from the previous value
jan 1, 1997
90.0K
+90.0K
0.0%
jan 1, 1998
820.0K
+730.0K
811.11%
jan 1, 1999
1.16 mln
+340.0K
41.46%
jan 1, 2000
1.69 mln
+530.0K
45.69%
jan 1, 2001
1.75 mln
+60.0K
3.55%
jan 1, 2002
2.07 mln
+320.0K
18.29%
jan 1, 2003
960.0K
-1.11 mln
-53.62%
jan 1, 2004
3.95 mln
+2.99 mln
311.46%
jan 1, 2005
5.32 mln
+1.37 mln
34.68%
Ranking of countries by current statistics by years