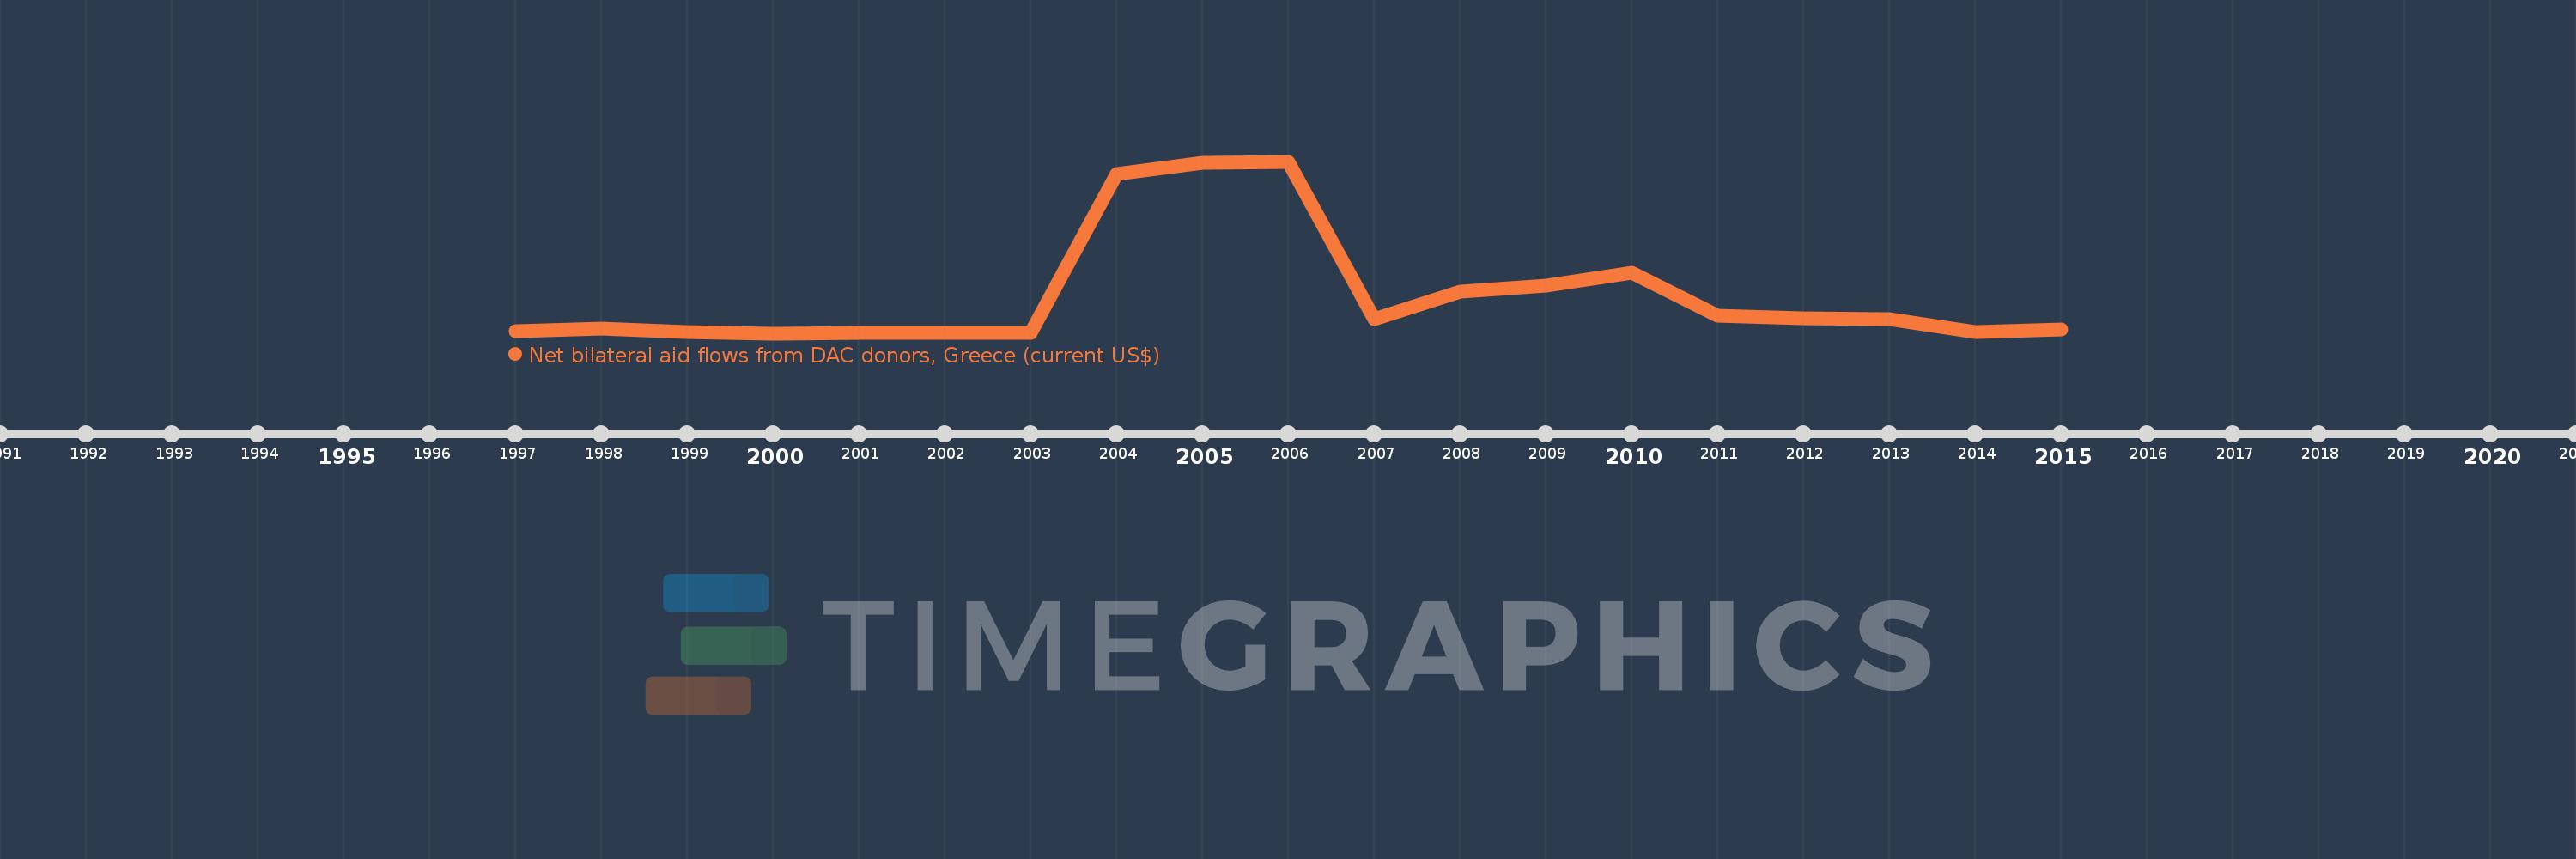
This timeline shows a graph from 1997 to 2015 of Iraq. No data until 1996. Number of actual observations by date: 18.
Source name:
World Development Indicators
Source organization:
Development Assistance Committee of the Organisation for Economic Co-operation and Development, Geographical Distribution of Financial Flows to Developing Countries, Development Co-operation Report, and International Development Statistics database. Data are available online at: www.oecd.org/dac/stats/idsonline.
Categories, topics:
Aid Effectiveness
Last updated:
apr 23, 2017
Indicators value changes by year
Meaning:
1.405 mln
Minimum:
30.0K
jan 1, 2000
Maximum:
5.88 mln
jan 1, 2006
At the date of observation
Value
Absolute change
Change from the previous value
jan 1, 1997
100.0K
+100.0K
0.0%
jan 1, 1998
180.0K
+80.0K
80.0%
jan 1, 1999
80.0K
-100.0K
-55.56%
jan 1, 2000
30.0K
-50.0K
-62.5%
jan 1, 2001
50.0K
+20.0K
66.67%
jan 1, 2003
40.0K
-10.0K
-20.0%
jan 1, 2004
5.47 mln
+5.43 mln
13.57K%
jan 1, 2005
5.83 mln
+360.0K
6.58%
jan 1, 2006
5.88 mln
+50.0K
0.86%
jan 1, 2007
520.0K
-5.36 mln
-91.16%
jan 1, 2008
1.44 mln
+920.0K
176.92%
jan 1, 2009
1.65 mln
+210.0K
14.58%
jan 1, 2010
2.08 mln
+430.0K
26.06%
jan 1, 2011
620.0K
-1.46 mln
-70.19%
jan 1, 2012
550.0K
-70.0K
-11.29%
jan 1, 2013
520.0K
-30.0K
-5.45%
jan 1, 2014
80.0K
-440.0K
-84.62%
jan 1, 2015
170.0K
+90.0K
112.5%
Ranking of countries by current statistics by years