33
/
AIzaSyAYiBZKx7MnpbEhh9jyipgxe19OcubqV5w
August 1, 2025
37596
IDA & IBRD total
IBT
false
2
1
Net bilateral aid flows from DAC donors, Greece (current US$)
2015,2014,2013,2012,2011,2010,2009,2008,2007,2006,2005,2004,2003,2002,2001,2000,1999,1998,1997
Download
Global statistics library →IDA & IBRD total →

Net bilateral aid flows from DAC donors, Greece (current US$)

This statistics in other country:

AfghanistanAlbaniaAlgeriaAngolaAntigua and BarbudaArab WorldArgentinaArmeniaAzerbaijanBangladeshBarbadosBelarusBelizeBeninBhutanBoliviaBosnia and HerzegovinaBotswanaBrazilBulgariaBurkina FasoBurundiCabo VerdeCambodiaCameroonCaribbean small statesCentral African RepublicCentral Europe and the BalticsChadChileChinaColombiaComorosCongo, Dem. Rep.Congo, Rep.Costa RicaCote d'IvoireCroatiaCubaCyprusCzech RepublicDjiboutiDominicaDominican RepublicEast Asia & PacificEast Asia & Pacific (excluding high income)East Asia & Pacific (IDA & IBRD countries)EcuadorEgypt, Arab Rep.El SalvadorEquatorial GuineaEritreaEstoniaEthiopiaEuro areaEurope & Central AsiaEurope & Central Asia (excluding high income)Europe & Central Asia (IDA & IBRD countries)European UnionFijiFragile and conflict affected situationsGabonGambia, TheGeorgiaGhanaGrenadaGuatemalaGuineaGuinea-BissauGuyanaHaitiHeavily indebted poor countries (HIPC)High incomeHondurasHungaryIBRD onlyIDA & IBRD totalIDA blendIDA onlyIDA totalIndiaIndonesiaIran, Islamic Rep.IraqIsraelJamaicaJordanKazakhstanKenyaKiribatiKorea, Dem. People’s Rep.Korea, Rep.KosovoKyrgyz RepublicLao PDRLatin America & Caribbean Latin America & Caribbean (excluding high income)Latin America & the Caribbean (IDA & IBRD countries)LatviaLeast developed countries: UN classificationLebanonLesothoLiberiaLibyaLithuaniaLow & middle incomeLow incomeLower middle incomeMacedonia, FYRMadagascarMalawiMaldivesMaliMaltaMarshall IslandsMauritaniaMauritiusMexicoMicronesia, Fed. Sts.Middle East & North AfricaMiddle East & North Africa (excluding high income)Middle East & North Africa (IDA & IBRD countries)Middle incomeMoldovaMongoliaMontenegroMoroccoMozambiqueMyanmarNamibiaNauruNepalNicaraguaNigerNigeriaOECD membersOmanOther small statesPacific island small statesPakistanPalauPanamaPapua New GuineaPeruPhilippinesPolandRomaniaRussian FederationRwandaSamoaSao Tome and PrincipeSaudi ArabiaSenegalSerbiaSeychellesSierra LeoneSlovak RepublicSloveniaSmall statesSolomon IslandsSomaliaSouth AfricaSouth AsiaSouth Asia (IDA & IBRD)Sri LankaSt. Kitts and NevisSt. LuciaSt. Vincent and the GrenadinesSub-Saharan Africa Sub-Saharan Africa (excluding high income)Sub-Saharan Africa (IDA & IBRD countries)SudanSurinameSwazilandSyrian Arab RepublicTajikistanTanzaniaThailandTimor-LesteTogoTongaTrinidad and TobagoTunisiaTurkeyTurkmenistanTuvaluUgandaUkraineUpper middle incomeUruguayUzbekistanVanuatuVenezuela, RBVietnamWest Bank and GazaWorldYemen, Rep.ZambiaZimbabwe

Timeline:

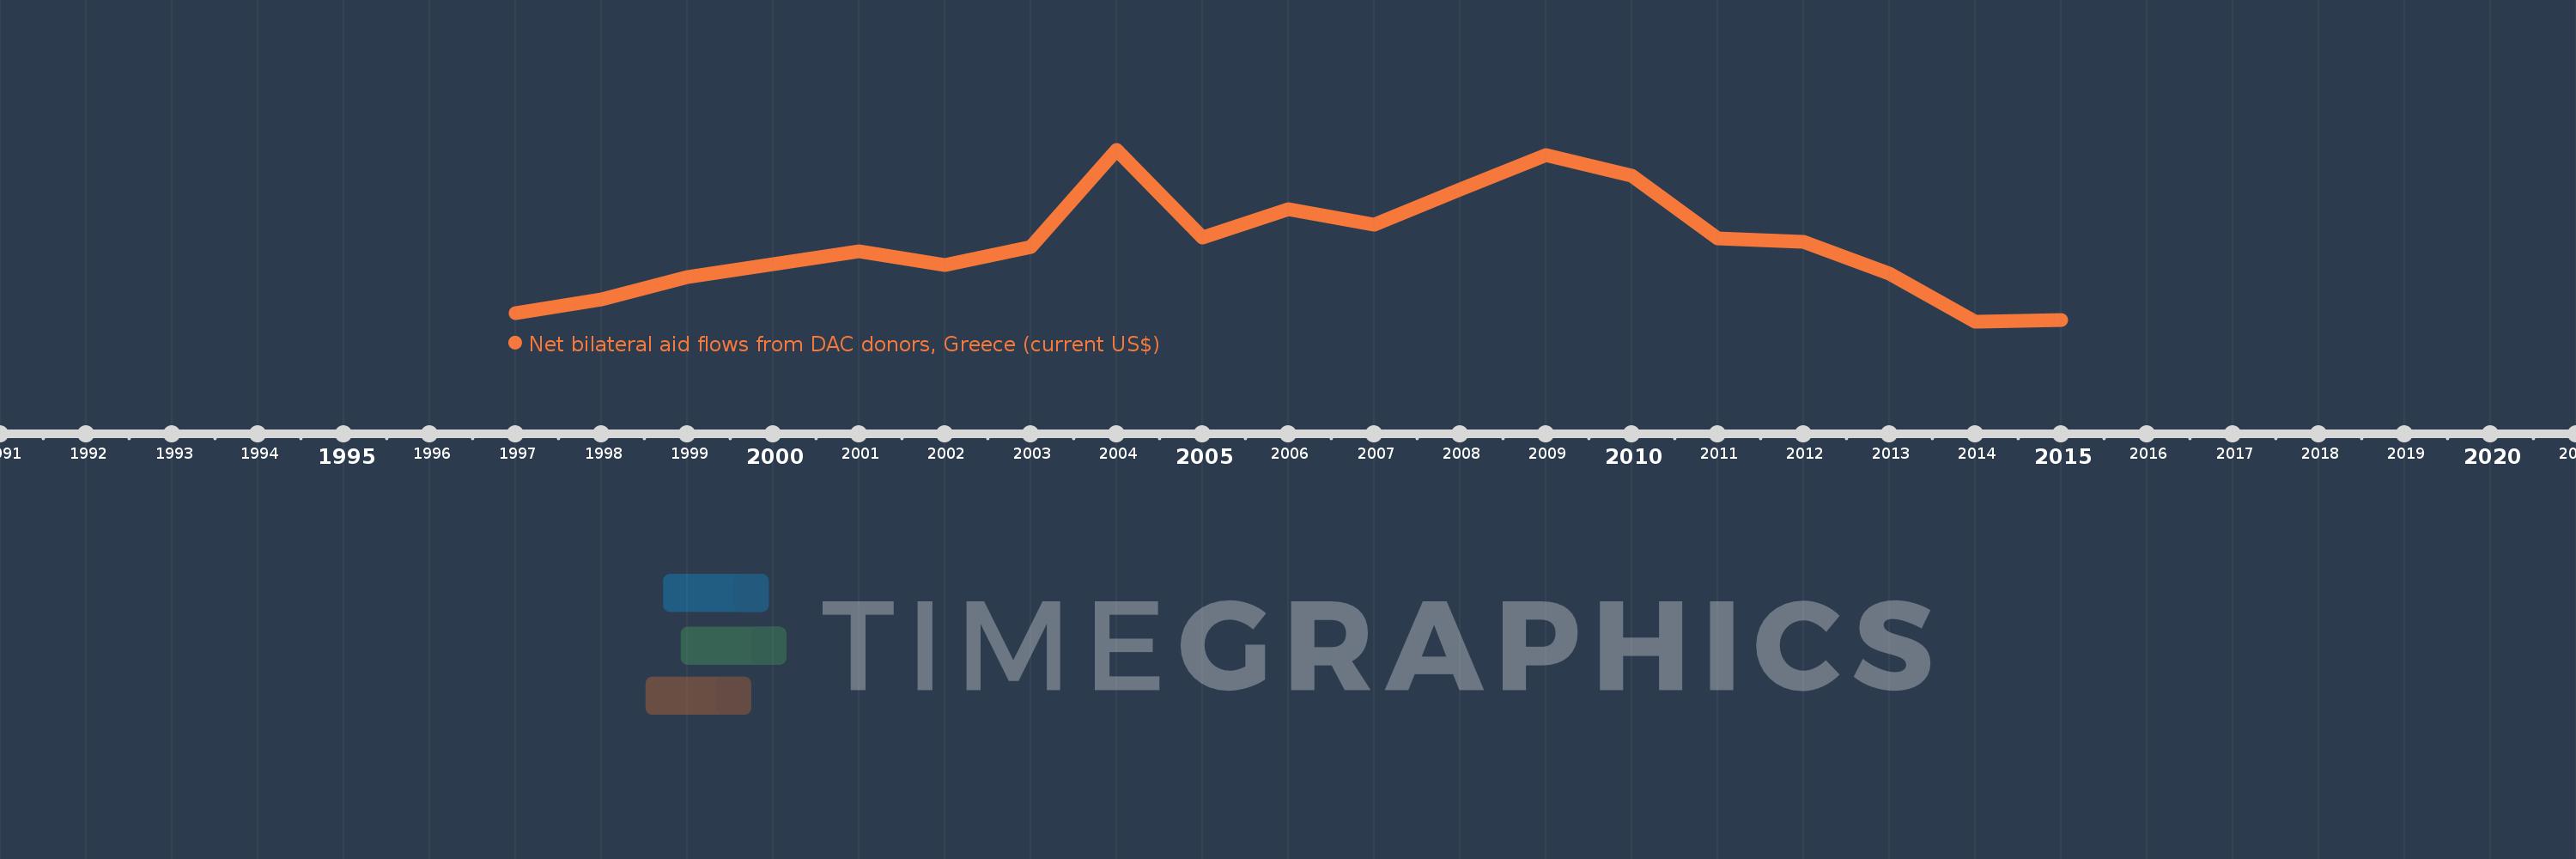
This timeline shows a graph from 1997 to 2015 of IDA & IBRD total. No data until 1996. Number of actual observations by date: 19.

Source name:

World Development Indicators

Source organization:

Development Assistance Committee of the Organisation for Economic Co-operation and Development, Geographical Distribution of Financial Flows to Developing Countries, Development Co-operation Report, and International Development Statistics database. Data are available online at: www.oecd.org/dac/stats/idsonline.

Categories, topics:

Aid Effectiveness

Last updated:

apr 23, 2017

Indicators value changes by year

Meaning:
104.661 mln
Minimum:
13.02 mln
jan 1, 2014
Maximum:
217.65 mln
jan 1, 2004
At the date of observation
Value
Absolute change
Change from the previous value
jan 1, 1997
23.85 mln
+23.85 mln
0.0%
jan 1, 1998
39.99 mln
+16.14 mln
67.67%
jan 1, 1999
66.42 mln
+26.43 mln
66.09%
jan 1, 2000
81.52 mln
+15.1 mln
22.73%
jan 1, 2001
96.81 mln
+15.29 mln
18.76%
jan 1, 2002
80.48 mln
-16.33 mln
-16.87%
jan 1, 2003
102.28 mln
+21.8 mln
27.09%
jan 1, 2004
217.65 mln
+115.37 mln
112.8%
jan 1, 2005
114.01 mln
-103.64 mln
-47.62%
jan 1, 2006
147.13 mln
+33.12 mln
29.05%
jan 1, 2007
128.85 mln
-18.28 mln
-12.42%
jan 1, 2008
170.46 mln
+41.61 mln
32.29%
jan 1, 2009
211.5 mln
+41.04 mln
24.08%
jan 1, 2010
187.48 mln
-24.02 mln
-11.36%
jan 1, 2011
112.93 mln
-74.55 mln
-39.76%
jan 1, 2012
108.89 mln
-4.04 mln
-3.58%
jan 1, 2013
70.38 mln
-38.51 mln
-35.37%
jan 1, 2014
13.02 mln
-57.36 mln
-81.5%
jan 1, 2015
14.9 mln
+1.88 mln
14.44%

Ranking of countries by current statistics by years