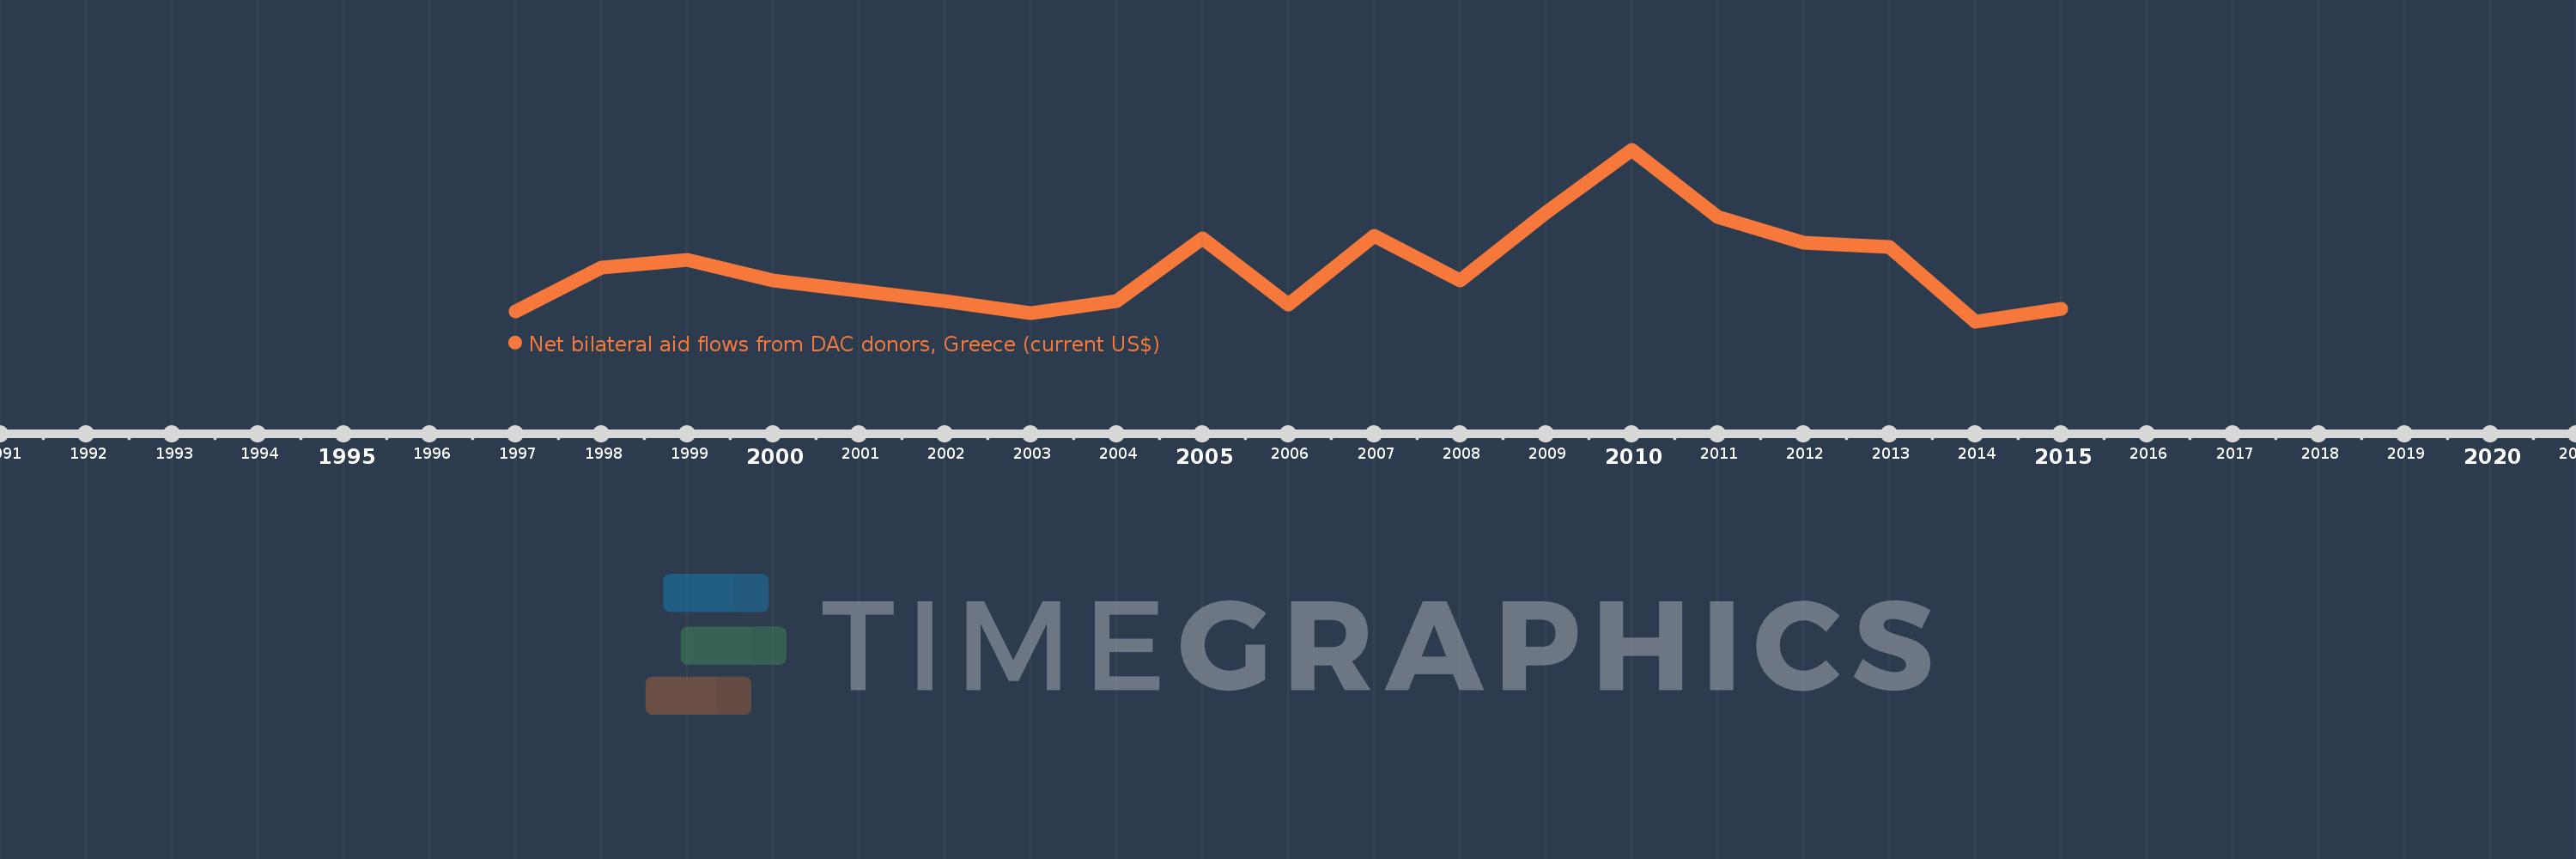
This timeline shows a graph from 1997 to 2015 of West Bank and Gaza. No data until 1996. Number of actual observations by date: 19.
Source name:
World Development Indicators
Source organization:
Development Assistance Committee of the Organisation for Economic Co-operation and Development, Geographical Distribution of Financial Flows to Developing Countries, Development Co-operation Report, and International Development Statistics database. Data are available online at: www.oecd.org/dac/stats/idsonline.
Categories, topics:
Aid Effectiveness
Last updated:
apr 23, 2017
Indicators value changes by year
Meaning:
3.929 mln
Minimum:
780.0K
jan 1, 2014
Maximum:
10.72 mln
jan 1, 2010
At the date of observation
Value
Absolute change
Change from the previous value
jan 1, 1997
1.4 mln
+1.4 mln
0.0%
jan 1, 1998
3.93 mln
+2.53 mln
180.71%
jan 1, 1999
4.38 mln
+450.0K
11.45%
jan 1, 2000
3.2 mln
-1.18 mln
-26.94%
jan 1, 2001
2.6 mln
-600.0K
-18.75%
jan 1, 2002
1.99 mln
-610.0K
-23.46%
jan 1, 2003
1.28 mln
-710.0K
-35.68%
jan 1, 2004
2.0 mln
+720.0K
56.25%
jan 1, 2005
5.64 mln
+3.64 mln
182.0%
jan 1, 2006
1.81 mln
-3.83 mln
-67.91%
jan 1, 2007
5.77 mln
+3.96 mln
218.78%
jan 1, 2008
3.17 mln
-2.6 mln
-45.06%
jan 1, 2009
7.13 mln
+3.96 mln
124.92%
jan 1, 2010
10.72 mln
+3.59 mln
50.35%
jan 1, 2011
6.85 mln
-3.87 mln
-36.1%
jan 1, 2012
5.35 mln
-1.5 mln
-21.9%
jan 1, 2013
5.14 mln
-210.0K
-3.93%
jan 1, 2014
780.0K
-4.36 mln
-84.82%
jan 1, 2015
1.52 mln
+740.0K
94.87%
Ranking of countries by current statistics by years