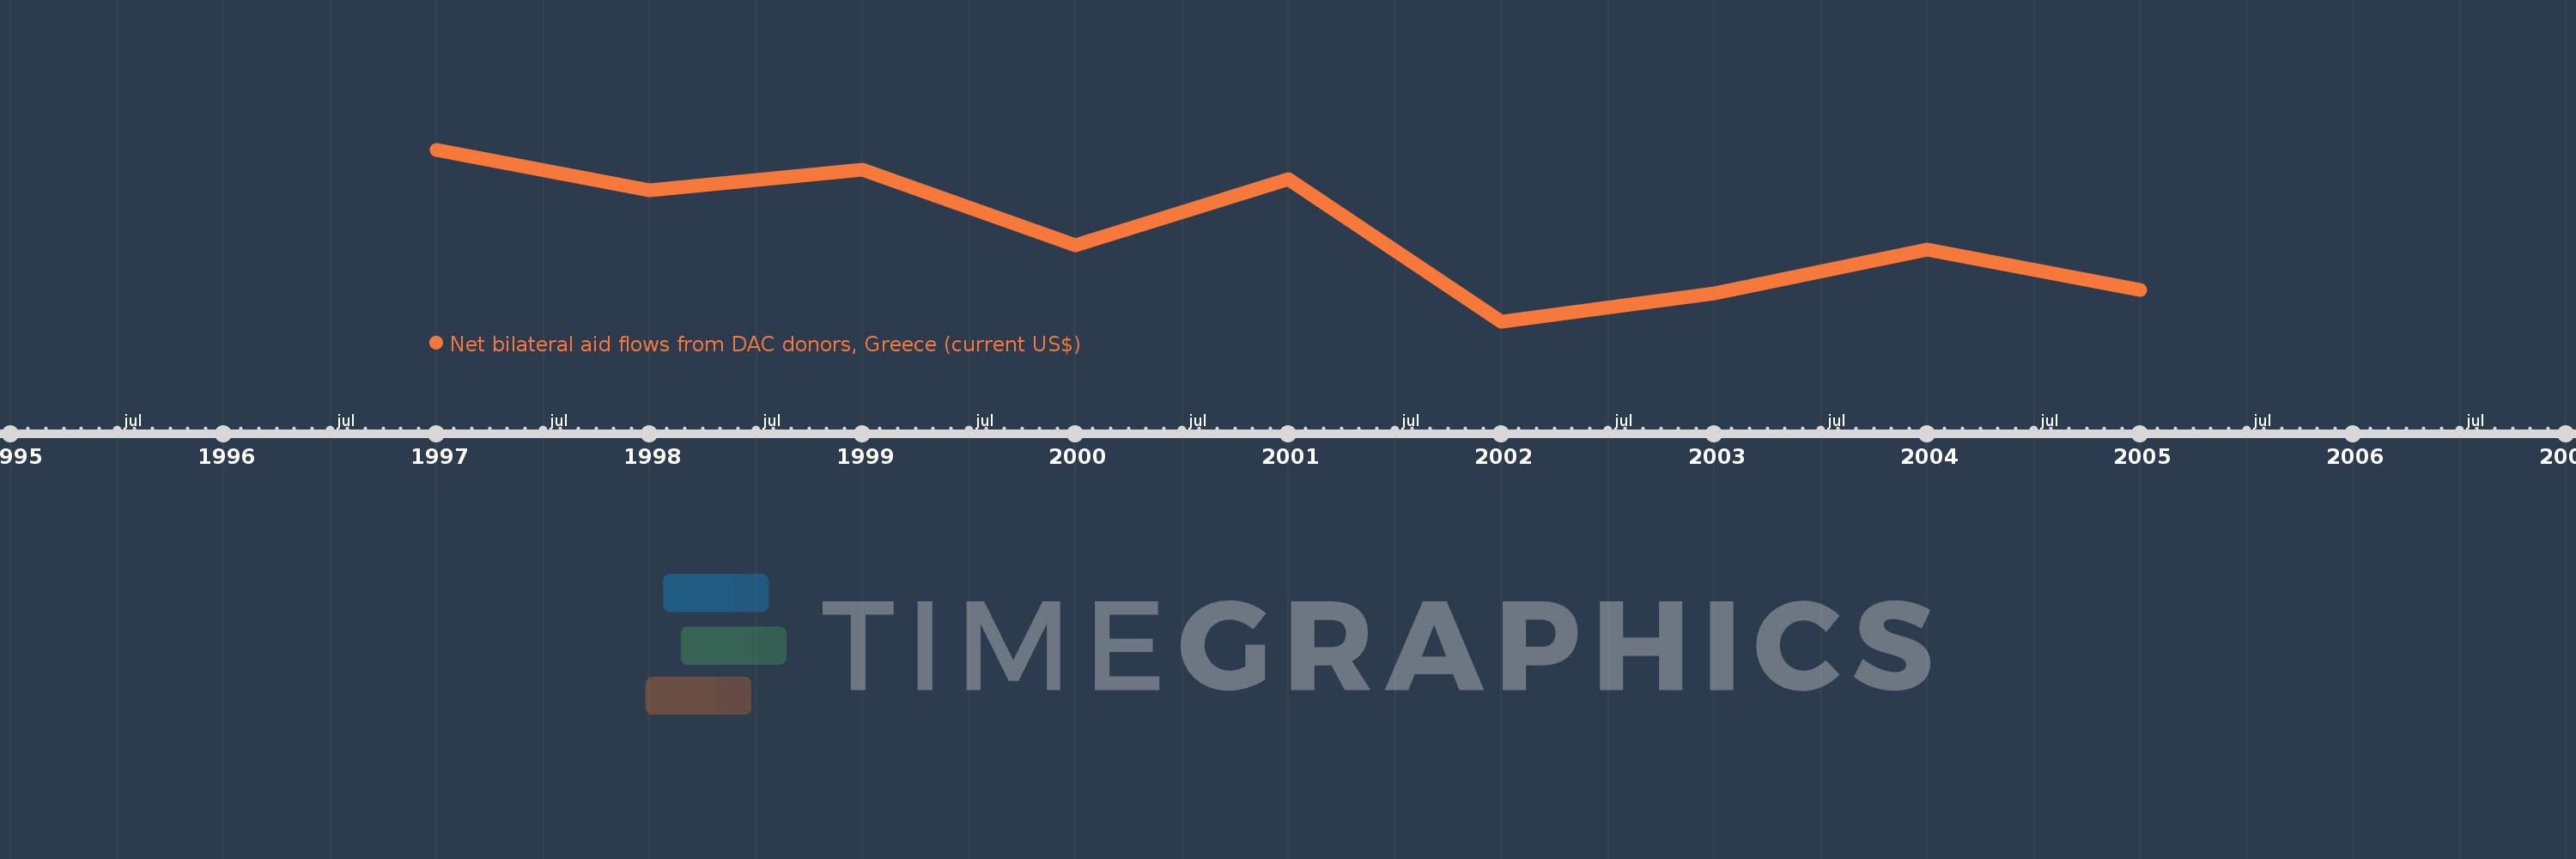
This timeline shows a graph from 1997 to 2005 of Cyprus. No data until 1996. Number of actual observations by date: 9.
Source name:
World Development Indicators
Source organization:
Development Assistance Committee of the Organisation for Economic Co-operation and Development, Geographical Distribution of Financial Flows to Developing Countries, Development Co-operation Report, and International Development Statistics database. Data are available online at: www.oecd.org/dac/stats/idsonline.
Categories, topics:
Aid Effectiveness
Last updated:
apr 23, 2017
Indicators value changes by year
Meaning:
561.111K
Minimum:
90.0K
jan 1, 2002
Maximum:
990.0K
jan 1, 1997
At the date of observation
Value
Absolute change
Change from the previous value
jan 1, 1997
990.0K
+990.0K
0.0%
jan 1, 1998
780.0K
-210.0K
-21.21%
jan 1, 1999
890.0K
+110.0K
14.1%
jan 1, 2000
490.0K
-400.0K
-44.94%
jan 1, 2001
840.0K
+350.0K
71.43%
jan 1, 2002
90.0K
-750.0K
-89.29%
jan 1, 2003
240.0K
+150.0K
166.67%
jan 1, 2004
470.0K
+230.0K
95.83%
jan 1, 2005
260.0K
-210.0K
-44.68%
Ranking of countries by current statistics by years