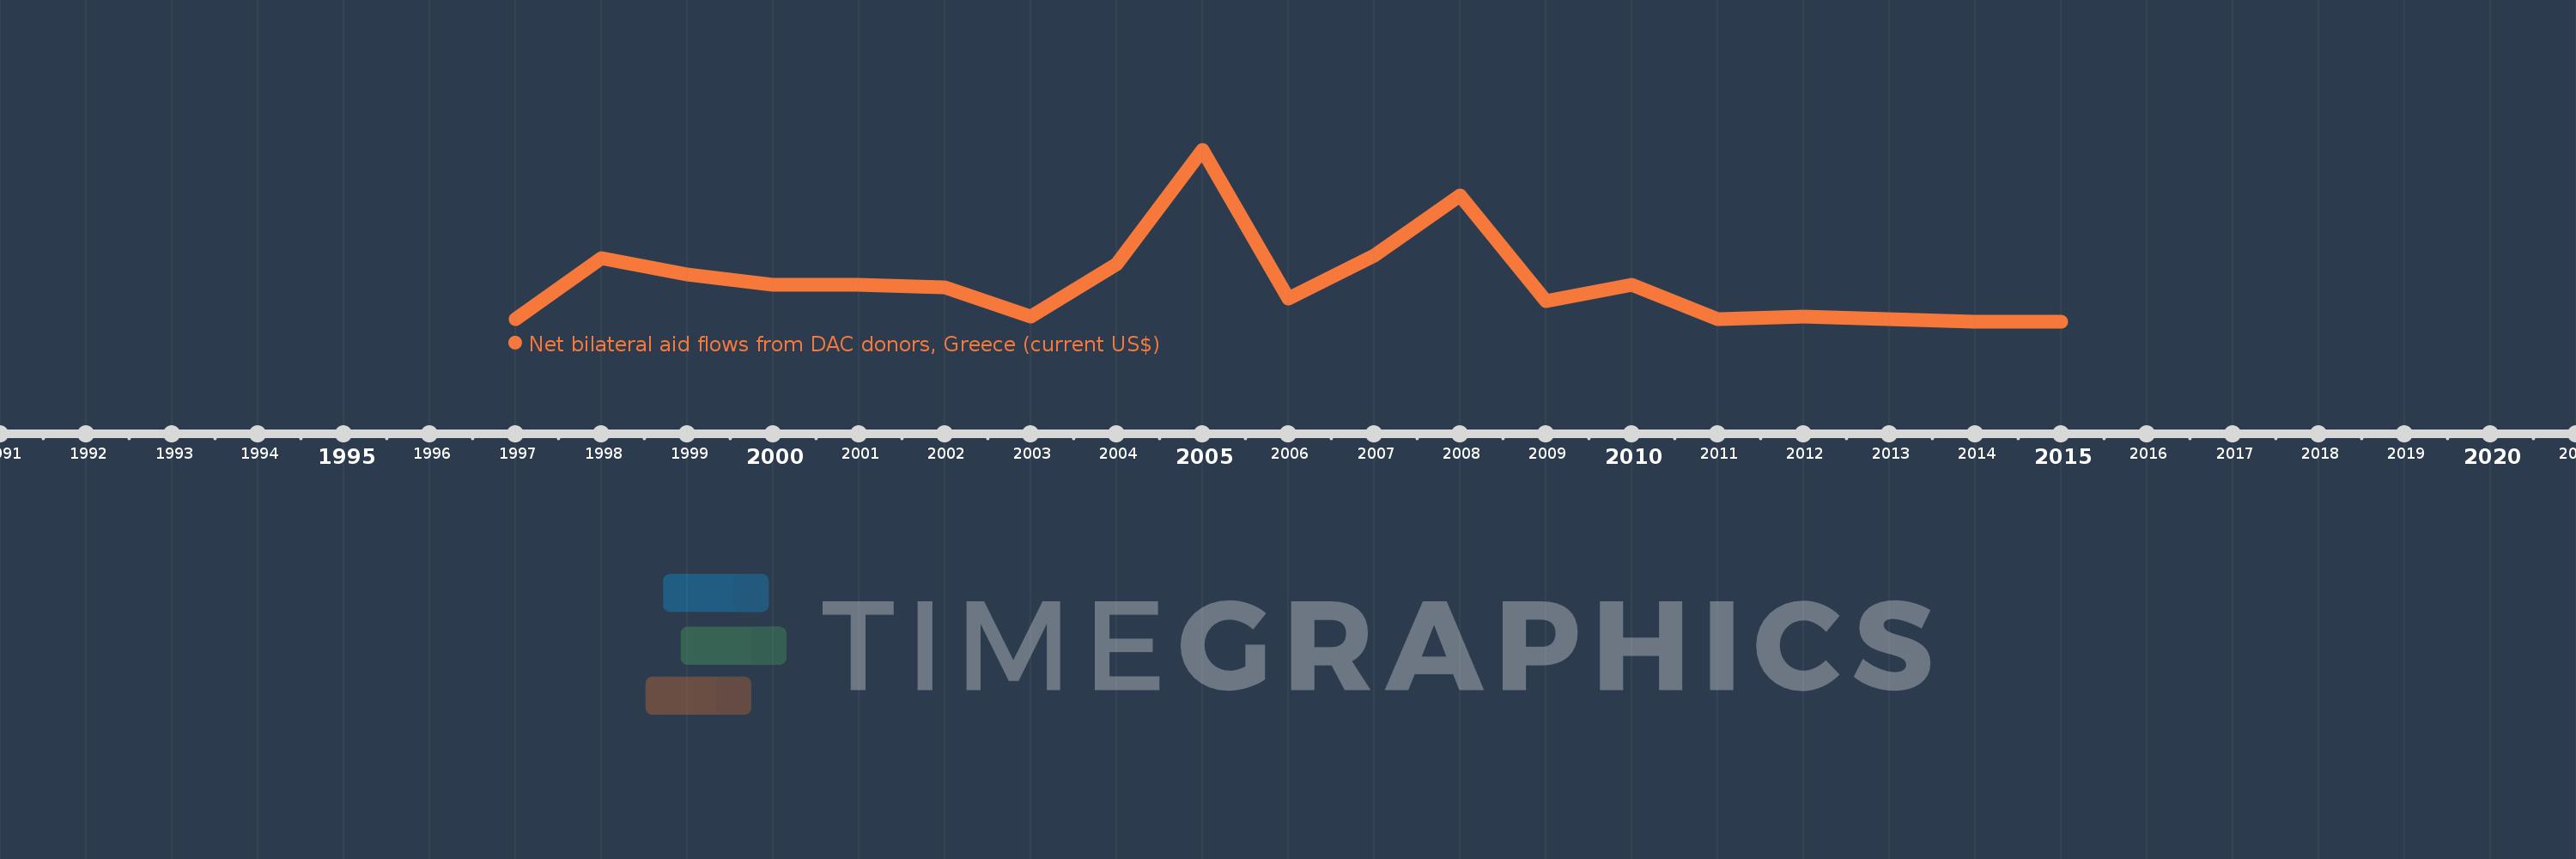
This timeline shows a graph from 1997 to 2015 of Cote d'Ivoire. No data until 1996. Number of actual observations by date: 19.
Source name:
World Development Indicators
Source organization:
Development Assistance Committee of the Organisation for Economic Co-operation and Development, Geographical Distribution of Financial Flows to Developing Countries, Development Co-operation Report, and International Development Statistics database. Data are available online at: www.oecd.org/dac/stats/idsonline.
Categories, topics:
Aid Effectiveness
Last updated:
apr 23, 2017
Indicators value changes by year
Meaning:
157.895K
Minimum:
10.0K
jan 1, 2014
Maximum:
660.0K
jan 1, 2005
At the date of observation
Value
Absolute change
Change from the previous value
jan 1, 1997
20.0K
+20.0K
0.0%
jan 1, 1998
250.0K
+230.0K
1.15K%
jan 1, 1999
190.0K
-60.0K
-24.0%
jan 1, 2000
150.0K
-40.0K
-21.05%
jan 1, 2001
150.0K
0.0
0.0%
jan 1, 2002
140.0K
-10.0K
-6.67%
jan 1, 2003
30.0K
-110.0K
-78.57%
jan 1, 2004
230.0K
+200.0K
666.67%
jan 1, 2005
660.0K
+430.0K
186.96%
jan 1, 2006
100.0K
-560.0K
-84.85%
jan 1, 2007
260.0K
+160.0K
160.0%
jan 1, 2008
490.0K
+230.0K
88.46%
jan 1, 2009
90.0K
-400.0K
-81.63%
jan 1, 2010
150.0K
+60.0K
66.67%
jan 1, 2011
20.0K
-130.0K
-86.67%
jan 1, 2012
30.0K
+10.0K
50.0%
jan 1, 2013
20.0K
-10.0K
-33.33%
jan 1, 2014
10.0K
-10.0K
-50.0%
jan 1, 2015
10.0K
0.0
0.0%
Ranking of countries by current statistics by years