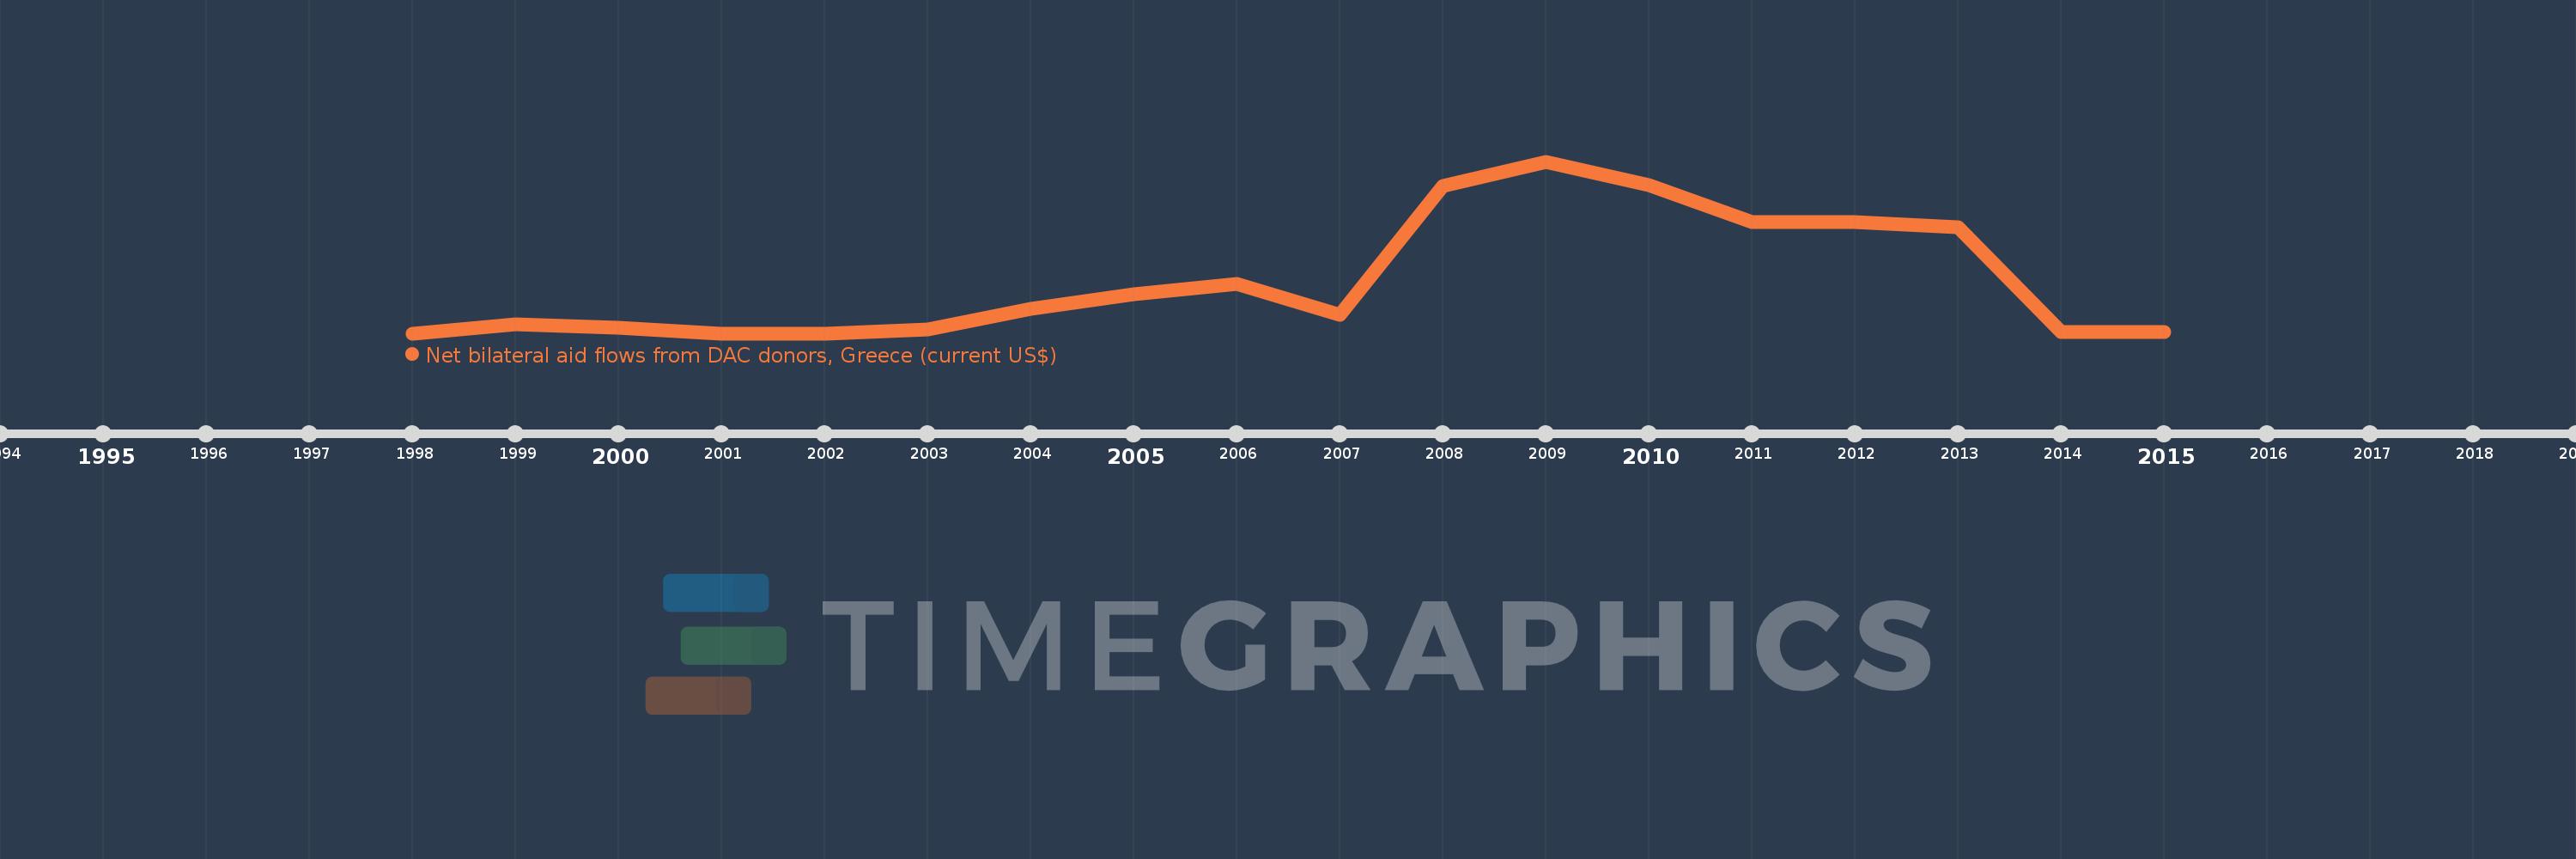
This timeline shows a graph from 1998 to 2015 of Nigeria. No data until 1997. Number of actual observations by date: 18.
Source name:
World Development Indicators
Source organization:
Development Assistance Committee of the Organisation for Economic Co-operation and Development, Geographical Distribution of Financial Flows to Developing Countries, Development Co-operation Report, and International Development Statistics database. Data are available online at: www.oecd.org/dac/stats/idsonline.
Categories, topics:
Aid Effectiveness
Last updated:
apr 23, 2017
Indicators value changes by year
Meaning:
691.111K
Minimum:
10.0K
jan 1, 1998
Maximum:
2.23 mln
jan 1, 2009
At the date of observation
Value
Absolute change
Change from the previous value
jan 1, 1998
10.0K
+10.0K
0.0%
jan 1, 1999
130.0K
+120.0K
1.2K%
jan 1, 2000
80.0K
-50.0K
-38.46%
jan 1, 2001
10.0K
-70.0K
-87.5%
jan 1, 2002
10.0K
0.0
0.0%
jan 1, 2003
60.0K
+50.0K
500.0%
jan 1, 2004
330.0K
+270.0K
450.0%
jan 1, 2005
510.0K
+180.0K
54.55%
jan 1, 2006
650.0K
+140.0K
27.45%
jan 1, 2007
250.0K
-400.0K
-61.54%
jan 1, 2008
1.91 mln
+1.66 mln
664.0%
jan 1, 2009
2.23 mln
+320.0K
16.75%
jan 1, 2010
1.92 mln
-310.0K
-13.9%
jan 1, 2011
1.45 mln
-470.0K
-24.48%
jan 1, 2012
1.45 mln
0.0
0.0%
jan 1, 2013
1.38 mln
-70.0K
-4.83%
jan 1, 2014
30.0K
-1.35 mln
-97.83%
jan 1, 2015
30.0K
0.0
0.0%
Ranking of countries by current statistics by years