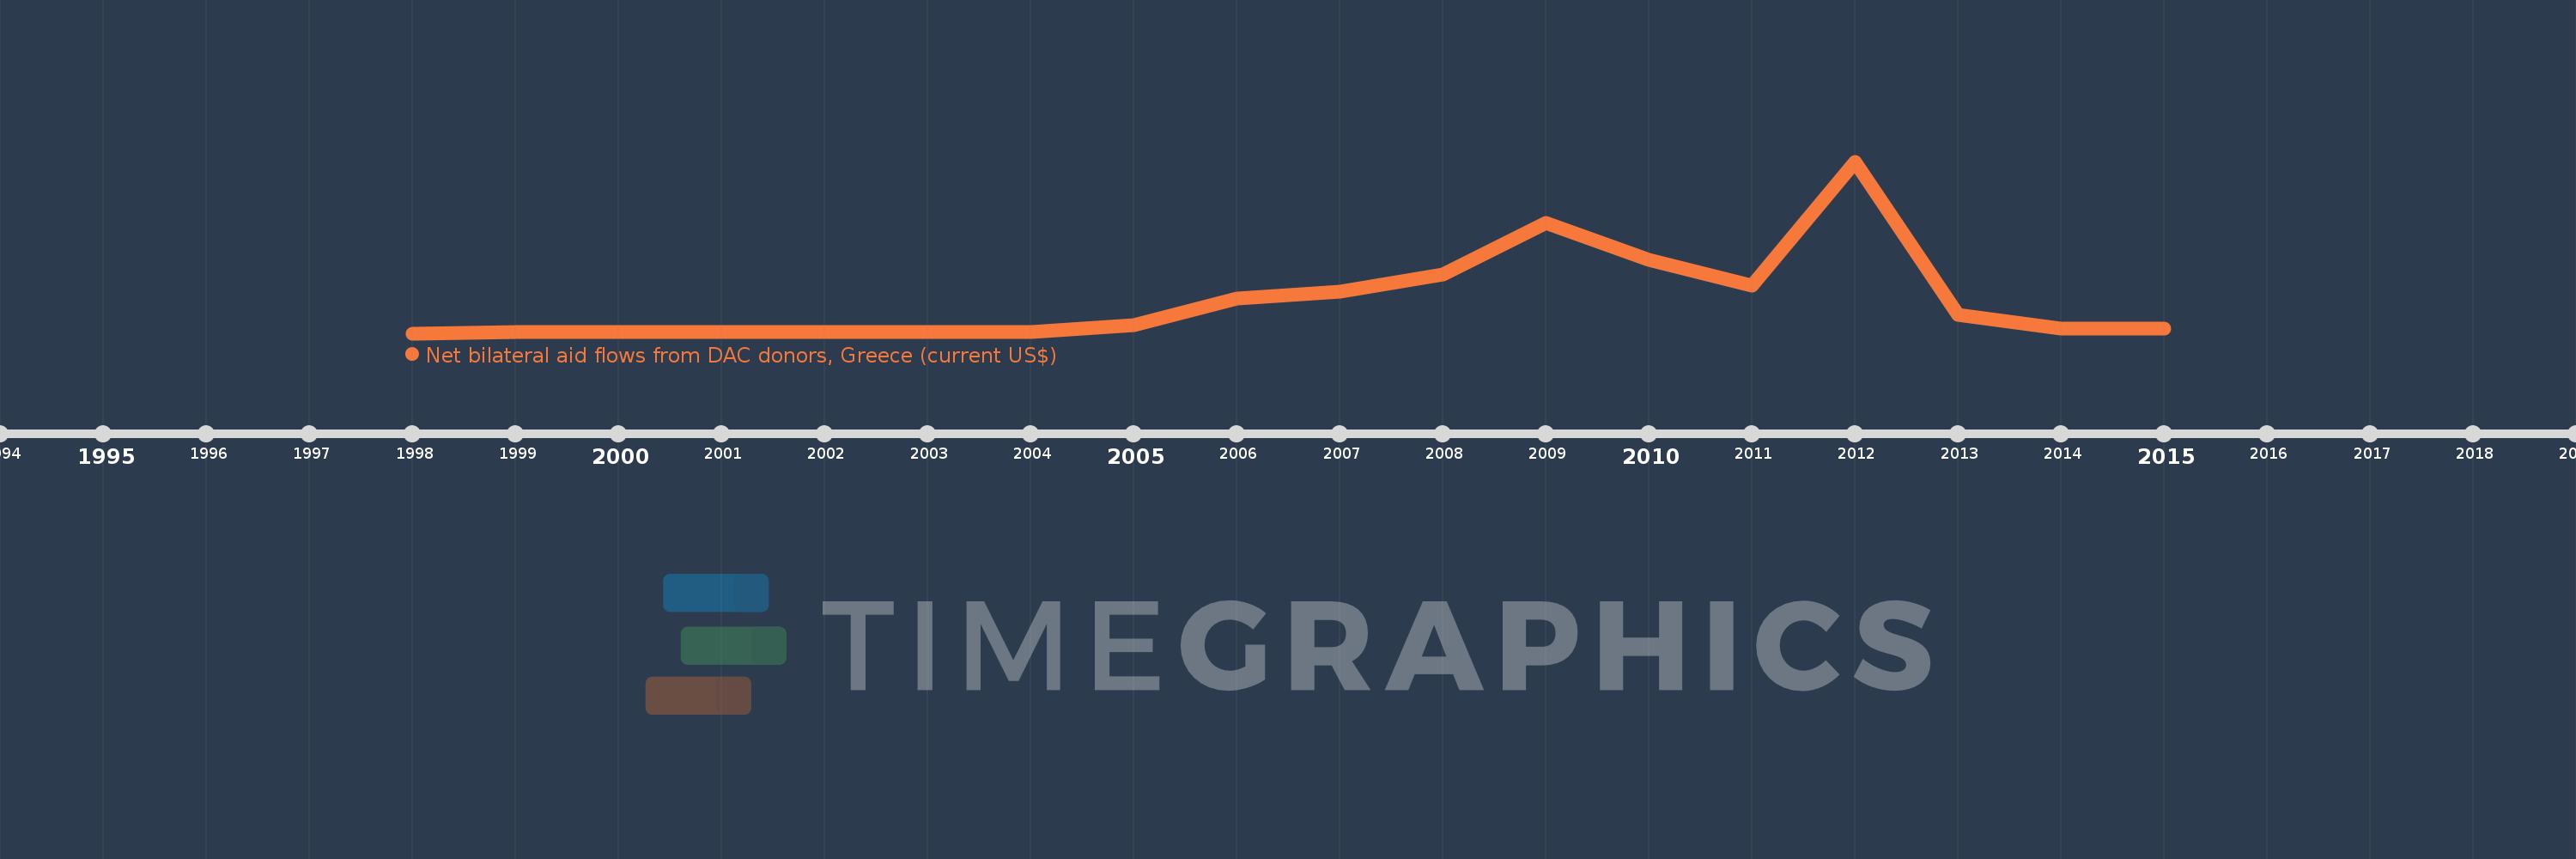
This timeline shows a graph from 1998 to 2015 of Libya. No data until 1997. Number of actual observations by date: 17.
Source name:
World Development Indicators
Source organization:
Development Assistance Committee of the Organisation for Economic Co-operation and Development, Geographical Distribution of Financial Flows to Developing Countries, Development Co-operation Report, and International Development Statistics database. Data are available online at: www.oecd.org/dac/stats/idsonline.
Categories, topics:
Aid Effectiveness
Last updated:
apr 23, 2017
Indicators value changes by year
Meaning:
311.765K
Minimum:
10.0K
jan 1, 1998
Maximum:
1.53 mln
jan 1, 2012
At the date of observation
Value
Absolute change
Change from the previous value
jan 1, 1998
10.0K
+10.0K
0.0%
jan 1, 1999
20.0K
+10.0K
100.0%
jan 1, 2000
20.0K
0.0
0.0%
jan 1, 2001
20.0K
0.0
0.0%
jan 1, 2003
20.0K
0.0
0.0%
jan 1, 2004
20.0K
0.0
0.0%
jan 1, 2005
80.0K
+60.0K
300.0%
jan 1, 2006
320.0K
+240.0K
300.0%
jan 1, 2007
380.0K
+60.0K
18.75%
jan 1, 2008
530.0K
+150.0K
39.47%
jan 1, 2009
990.0K
+460.0K
86.79%
jan 1, 2010
660.0K
-330.0K
-33.33%
jan 1, 2011
430.0K
-230.0K
-34.85%
jan 1, 2012
1.53 mln
+1.1 mln
255.81%
jan 1, 2013
170.0K
-1.36 mln
-88.89%
jan 1, 2014
50.0K
-120.0K
-70.59%
jan 1, 2015
50.0K
0.0
0.0%
Ranking of countries by current statistics by years