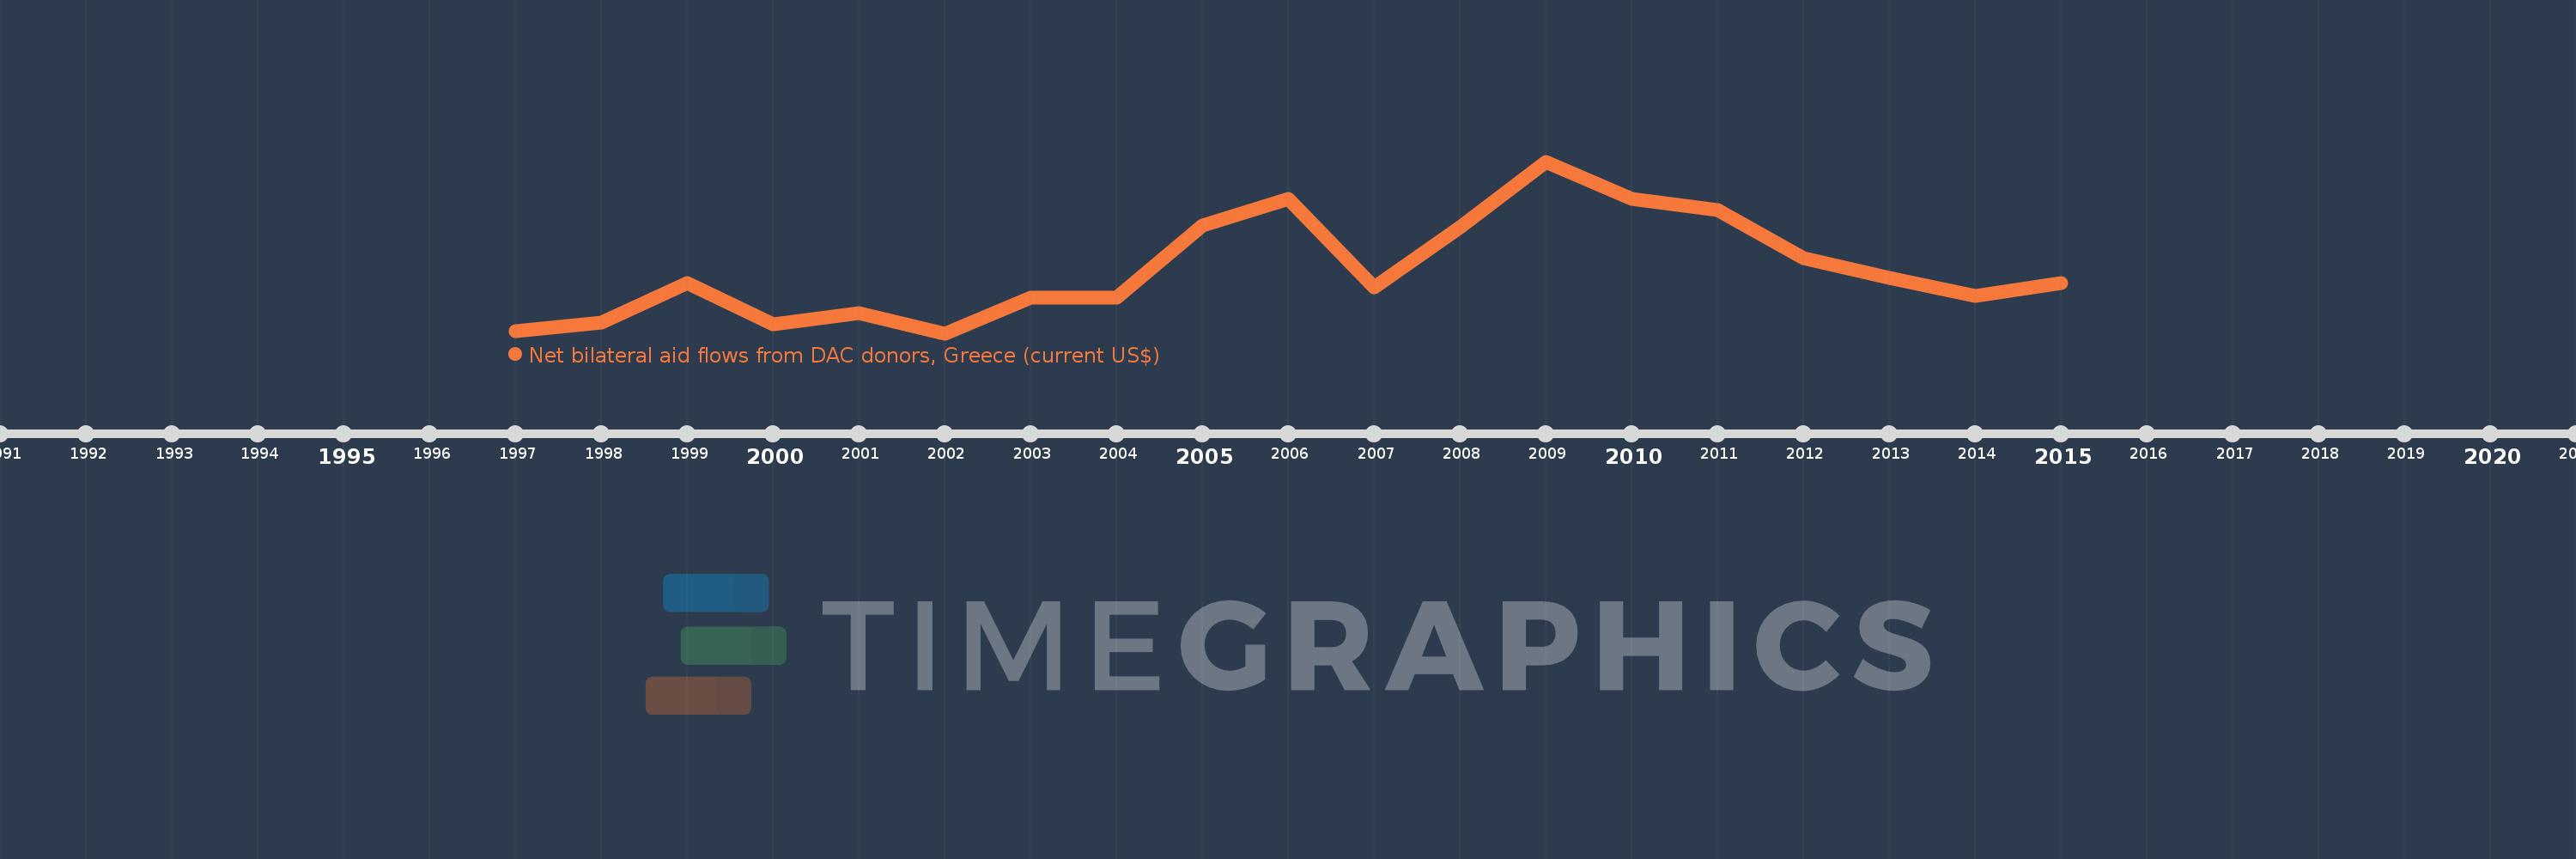
This timeline shows a graph from 1997 to 2015 of Congo, Rep.. No data until 1996. Number of actual observations by date: 19.
Source name:
World Development Indicators
Source organization:
Development Assistance Committee of the Organisation for Economic Co-operation and Development, Geographical Distribution of Financial Flows to Developing Countries, Development Co-operation Report, and International Development Statistics database. Data are available online at: www.oecd.org/dac/stats/idsonline.
Categories, topics:
Aid Effectiveness
Last updated:
apr 23, 2017
Indicators value changes by year
Meaning:
307.895K
Minimum:
20.0K
jan 1, 2002
Maximum:
800.0K
jan 1, 2009
At the date of observation
Value
Absolute change
Change from the previous value
jan 1, 1997
30.0K
+30.0K
0.0%
jan 1, 1998
70.0K
+40.0K
133.33%
jan 1, 1999
250.0K
+180.0K
257.14%
jan 1, 2000
60.0K
-190.0K
-76.0%
jan 1, 2001
110.0K
+50.0K
83.33%
jan 1, 2002
20.0K
-90.0K
-81.82%
jan 1, 2003
180.0K
+160.0K
800.0%
jan 1, 2004
180.0K
0.0
0.0%
jan 1, 2005
510.0K
+330.0K
183.33%
jan 1, 2006
630.0K
+120.0K
23.53%
jan 1, 2007
230.0K
-400.0K
-63.49%
jan 1, 2008
500.0K
+270.0K
117.39%
jan 1, 2009
800.0K
+300.0K
60.0%
jan 1, 2010
630.0K
-170.0K
-21.25%
jan 1, 2011
580.0K
-50.0K
-7.94%
jan 1, 2012
360.0K
-220.0K
-37.93%
jan 1, 2013
270.0K
-90.0K
-25.0%
jan 1, 2014
190.0K
-80.0K
-29.63%
jan 1, 2015
250.0K
+60.0K
31.58%
Ranking of countries by current statistics by years