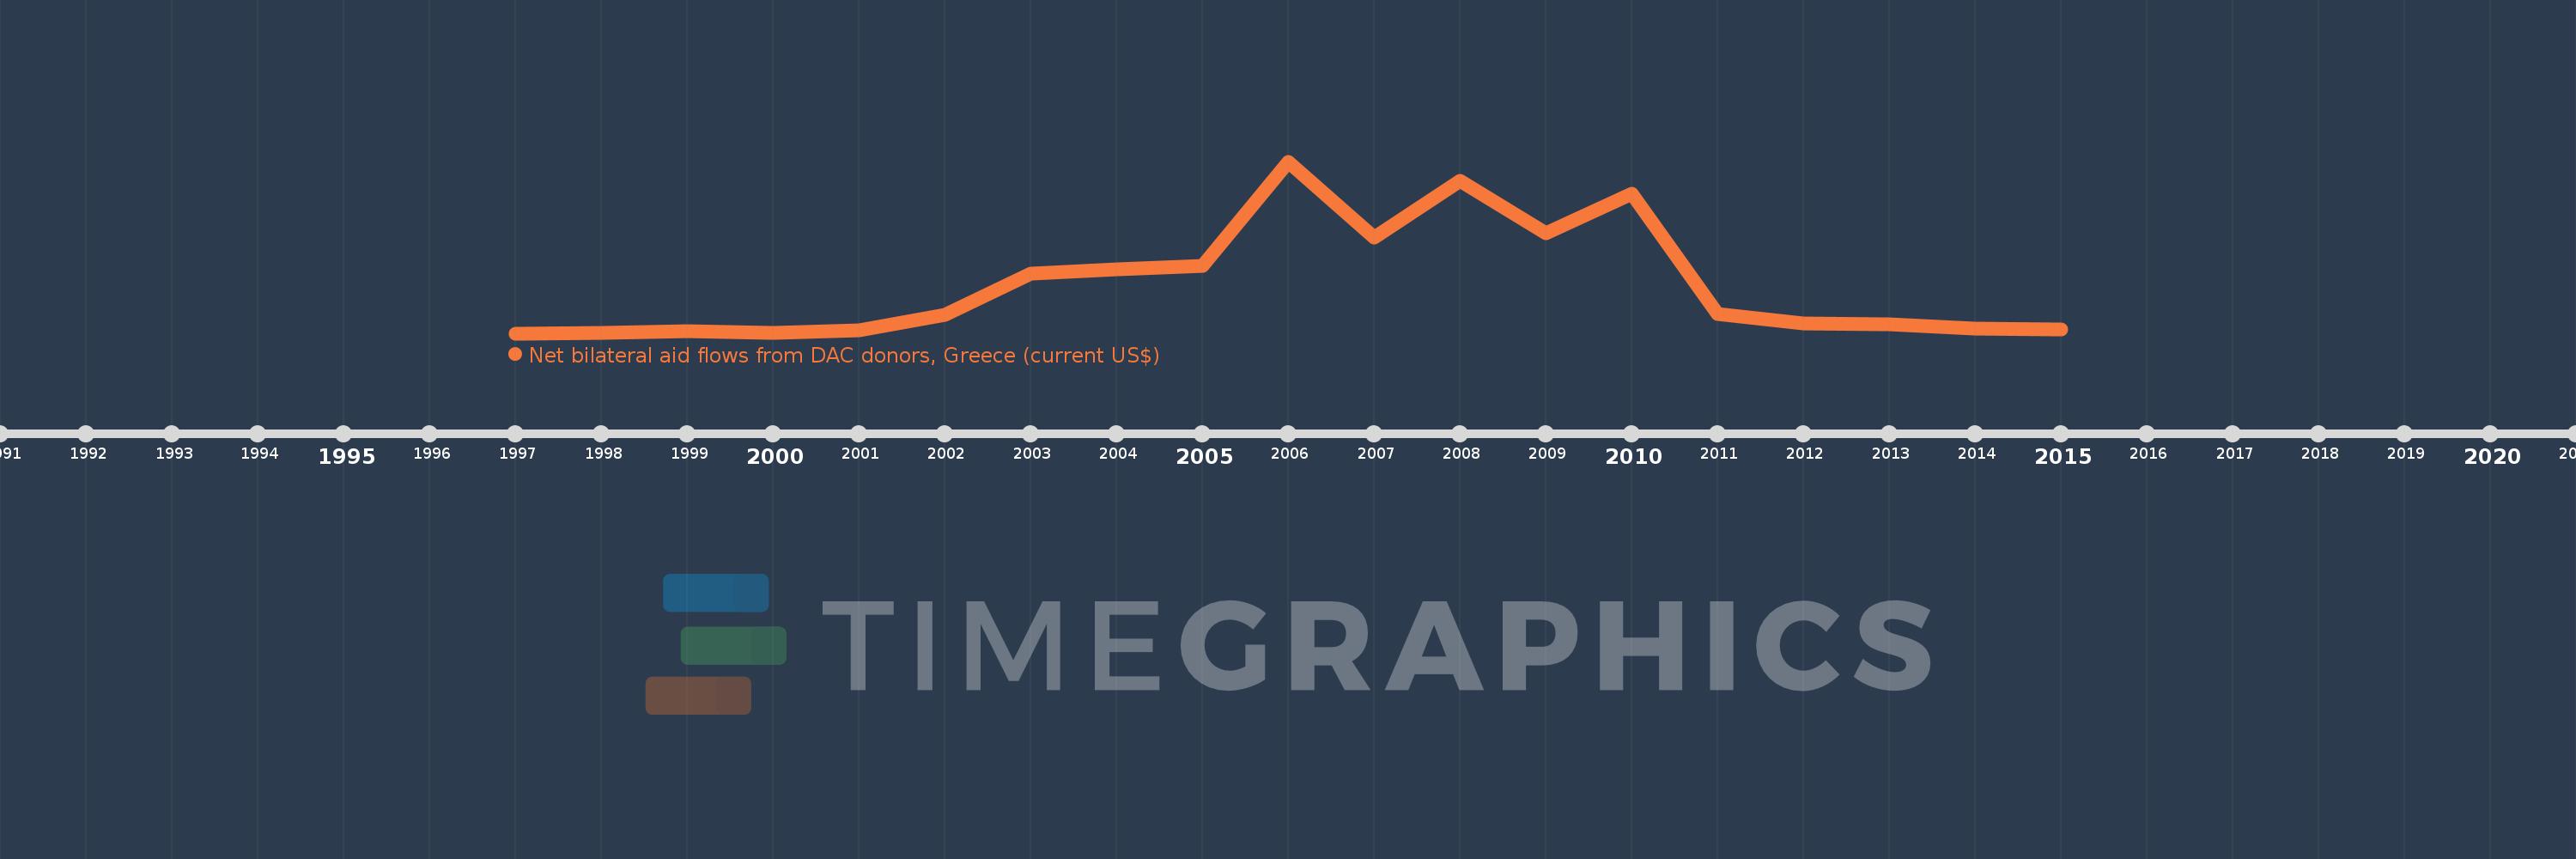
This timeline shows a graph from 1997 to 2015 of South Asia. No data until 1996. Number of actual observations by date: 19.
Source name:
World Development Indicators
Source organization:
Development Assistance Committee of the Organisation for Economic Co-operation and Development, Geographical Distribution of Financial Flows to Developing Countries, Development Co-operation Report, and International Development Statistics database. Data are available online at: www.oecd.org/dac/stats/idsonline.
Categories, topics:
Aid Effectiveness
Last updated:
apr 23, 2017
Indicators value changes by year
Meaning:
7.332 mln
Minimum:
0.0
jan 1, 1997
Maximum:
25.95 mln
jan 1, 2006
At the date of observation
Value
Absolute change
Change from the previous value
jan 1, 1997
0.0
0.0
0.0%
jan 1, 1998
80.0K
+80.0K
%
jan 1, 1999
290.0K
+210.0K
262.5%
jan 1, 2000
70.0K
-220.0K
-75.86%
jan 1, 2001
390.0K
+320.0K
457.14%
jan 1, 2002
2.75 mln
+2.36 mln
605.13%
jan 1, 2003
9.04 mln
+6.29 mln
228.73%
jan 1, 2004
9.64 mln
+600.0K
6.64%
jan 1, 2005
10.17 mln
+530.0K
5.5%
jan 1, 2006
25.95 mln
+15.78 mln
155.16%
jan 1, 2007
14.53 mln
-11.42 mln
-44.01%
jan 1, 2008
23.09 mln
+8.56 mln
58.91%
jan 1, 2009
15.12 mln
-7.97 mln
-34.52%
jan 1, 2010
21.02 mln
+5.9 mln
39.02%
jan 1, 2011
2.96 mln
-18.06 mln
-85.92%
jan 1, 2012
1.52 mln
-1.44 mln
-48.65%
jan 1, 2013
1.39 mln
-130.0K
-8.55%
jan 1, 2014
700.0K
-690.0K
-49.64%
jan 1, 2015
600.0K
-100.0K
-14.29%
Ranking of countries by current statistics by years