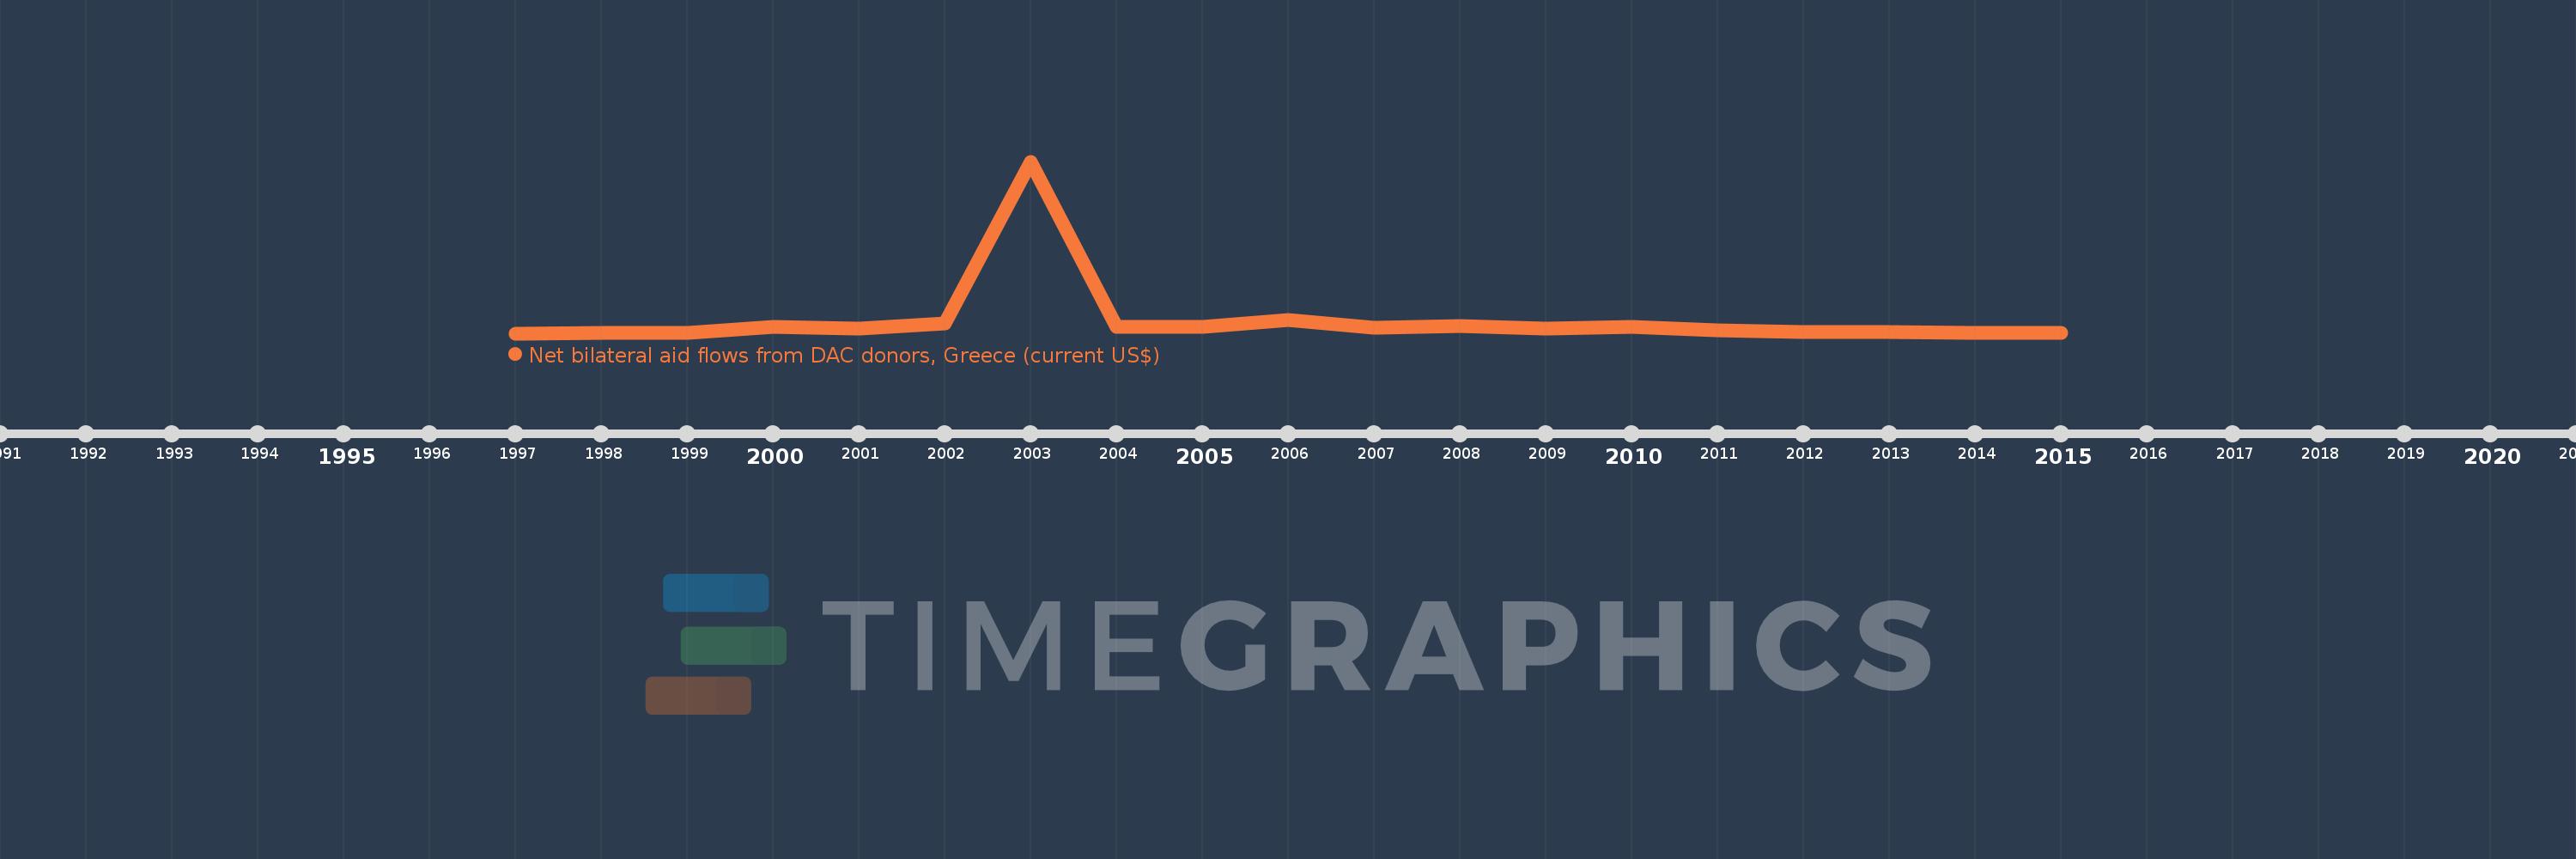
This timeline shows a graph from 1997 to 2015 of Macedonia, FYR. No data until 1996. Number of actual observations by date: 19.
Source name:
World Development Indicators
Source organization:
Development Assistance Committee of the Organisation for Economic Co-operation and Development, Geographical Distribution of Financial Flows to Developing Countries, Development Co-operation Report, and International Development Statistics database. Data are available online at: www.oecd.org/dac/stats/idsonline.
Categories, topics:
Aid Effectiveness
Last updated:
apr 23, 2017
Indicators value changes by year
Meaning:
3.712 mln
Minimum:
140.0K
jan 1, 1997
Maximum:
46.78 mln
jan 1, 2003
At the date of observation
Value
Absolute change
Change from the previous value
jan 1, 1997
140.0K
+140.0K
0.0%
jan 1, 1998
230.0K
+90.0K
64.29%
jan 1, 1999
310.0K
+80.0K
34.78%
jan 1, 2000
1.89 mln
+1.58 mln
509.68%
jan 1, 2001
1.38 mln
-510.0K
-26.98%
jan 1, 2002
2.75 mln
+1.37 mln
99.28%
jan 1, 2003
46.78 mln
+44.03 mln
1.6K%
jan 1, 2004
1.89 mln
-44.89 mln
-95.96%
jan 1, 2005
1.78 mln
-110.0K
-5.82%
jan 1, 2006
3.69 mln
+1.91 mln
107.3%
jan 1, 2007
1.68 mln
-2.01 mln
-54.47%
jan 1, 2008
2.06 mln
+380.0K
22.62%
jan 1, 2009
1.51 mln
-550.0K
-26.7%
jan 1, 2010
1.97 mln
+460.0K
30.46%
jan 1, 2011
890.0K
-1.08 mln
-54.82%
jan 1, 2012
570.0K
-320.0K
-35.96%
jan 1, 2013
450.0K
-120.0K
-21.05%
jan 1, 2014
250.0K
-200.0K
-44.44%
jan 1, 2015
310.0K
+60.0K
24.0%
Ranking of countries by current statistics by years