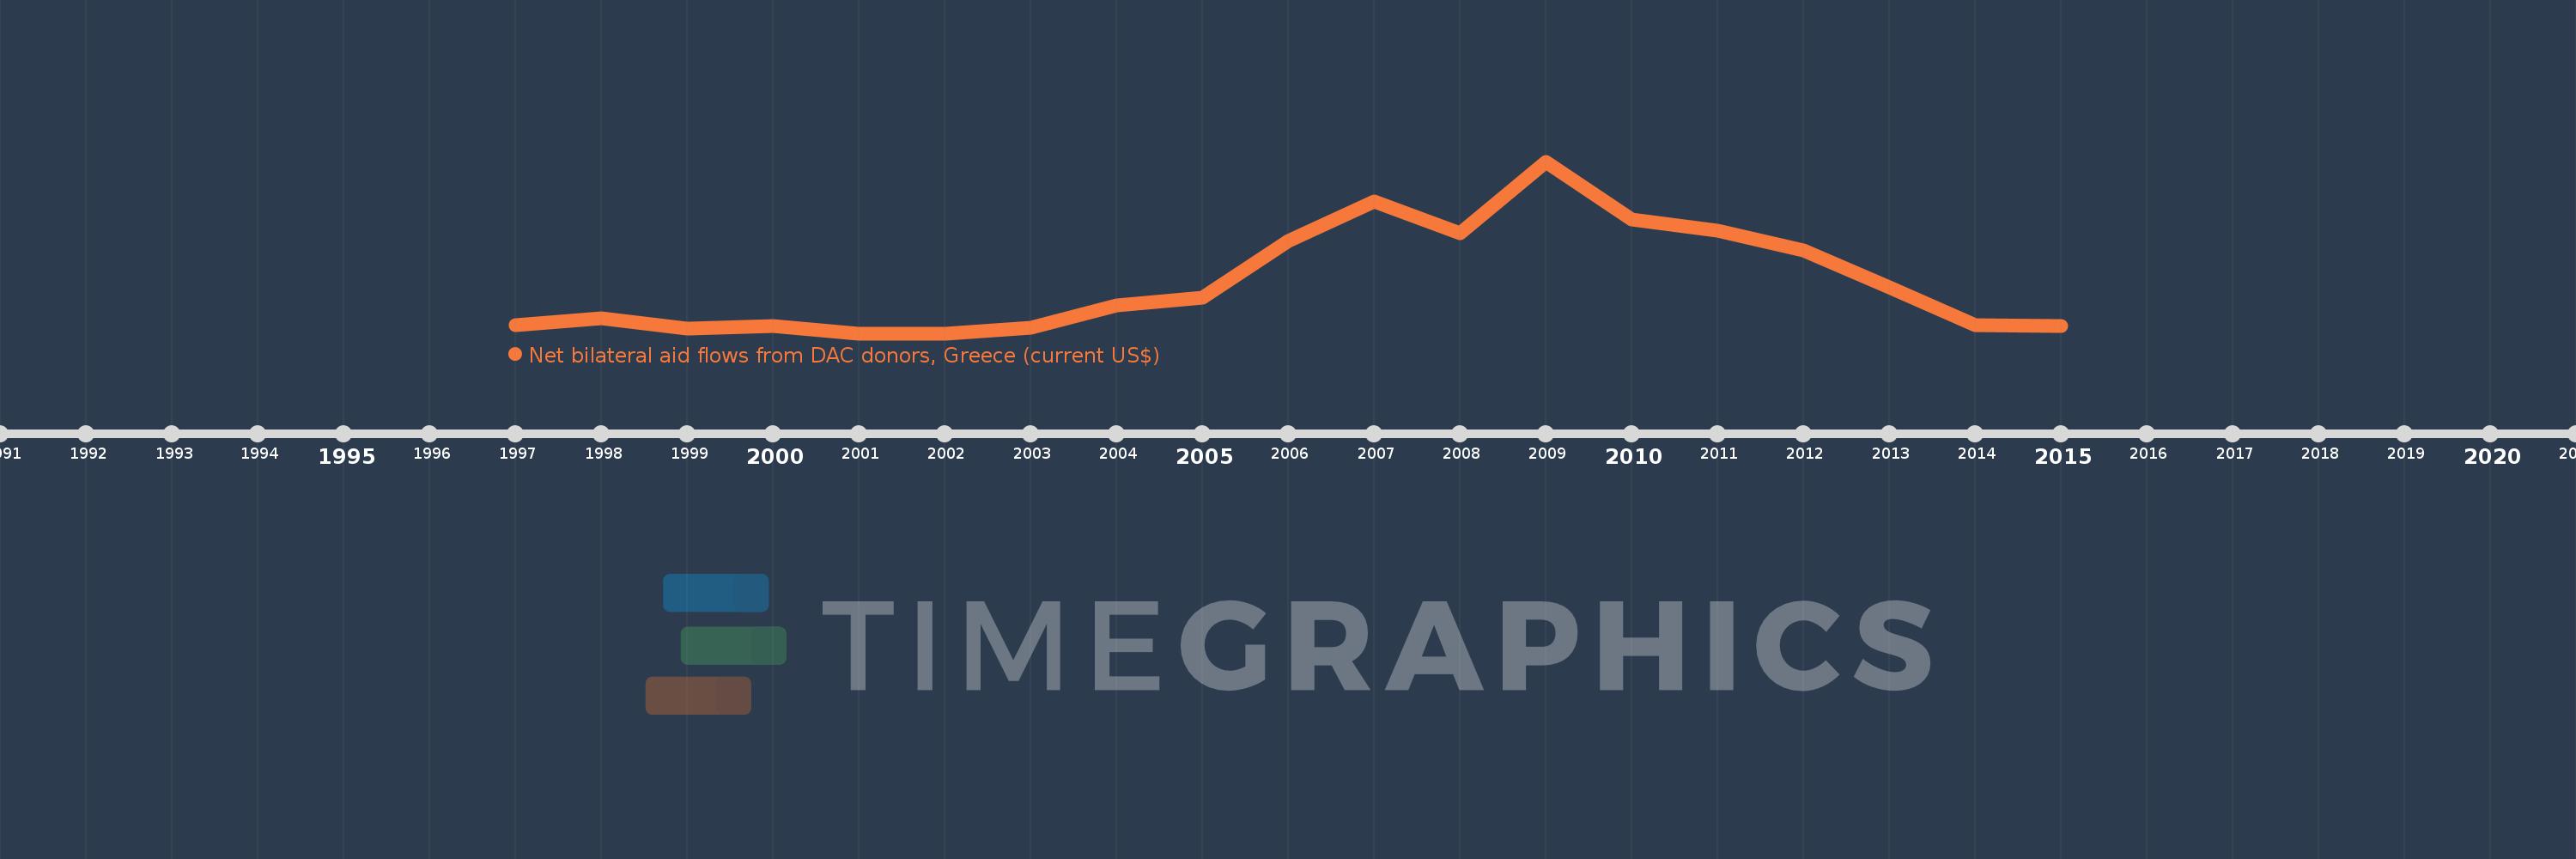
This timeline shows a graph from 1997 to 2015 of South Africa. No data until 1996. Number of actual observations by date: 19.
Source name:
World Development Indicators
Source organization:
Development Assistance Committee of the Organisation for Economic Co-operation and Development, Geographical Distribution of Financial Flows to Developing Countries, Development Co-operation Report, and International Development Statistics database. Data are available online at: www.oecd.org/dac/stats/idsonline.
Categories, topics:
Aid Effectiveness
Last updated:
apr 23, 2017
Indicators value changes by year
Meaning:
468.421K
Minimum:
30.0K
jan 1, 2001
Maximum:
1.52 mln
jan 1, 2009
At the date of observation
Value
Absolute change
Change from the previous value
jan 1, 1997
100.0K
+100.0K
0.0%
jan 1, 1998
160.0K
+60.0K
60.0%
jan 1, 1999
70.0K
-90.0K
-56.25%
jan 1, 2000
90.0K
+20.0K
28.57%
jan 1, 2001
30.0K
-60.0K
-66.67%
jan 1, 2002
30.0K
0.0
0.0%
jan 1, 2003
80.0K
+50.0K
166.67%
jan 1, 2004
270.0K
+190.0K
237.5%
jan 1, 2005
340.0K
+70.0K
25.93%
jan 1, 2006
830.0K
+490.0K
144.12%
jan 1, 2007
1.17 mln
+340.0K
40.96%
jan 1, 2008
900.0K
-270.0K
-23.08%
jan 1, 2009
1.52 mln
+620.0K
68.89%
jan 1, 2010
1.02 mln
-500.0K
-32.89%
jan 1, 2011
920.0K
-100.0K
-9.8%
jan 1, 2012
750.0K
-170.0K
-18.48%
jan 1, 2013
430.0K
-320.0K
-42.67%
jan 1, 2014
100.0K
-330.0K
-76.74%
jan 1, 2015
90.0K
-10.0K
-10.0%
Ranking of countries by current statistics by years