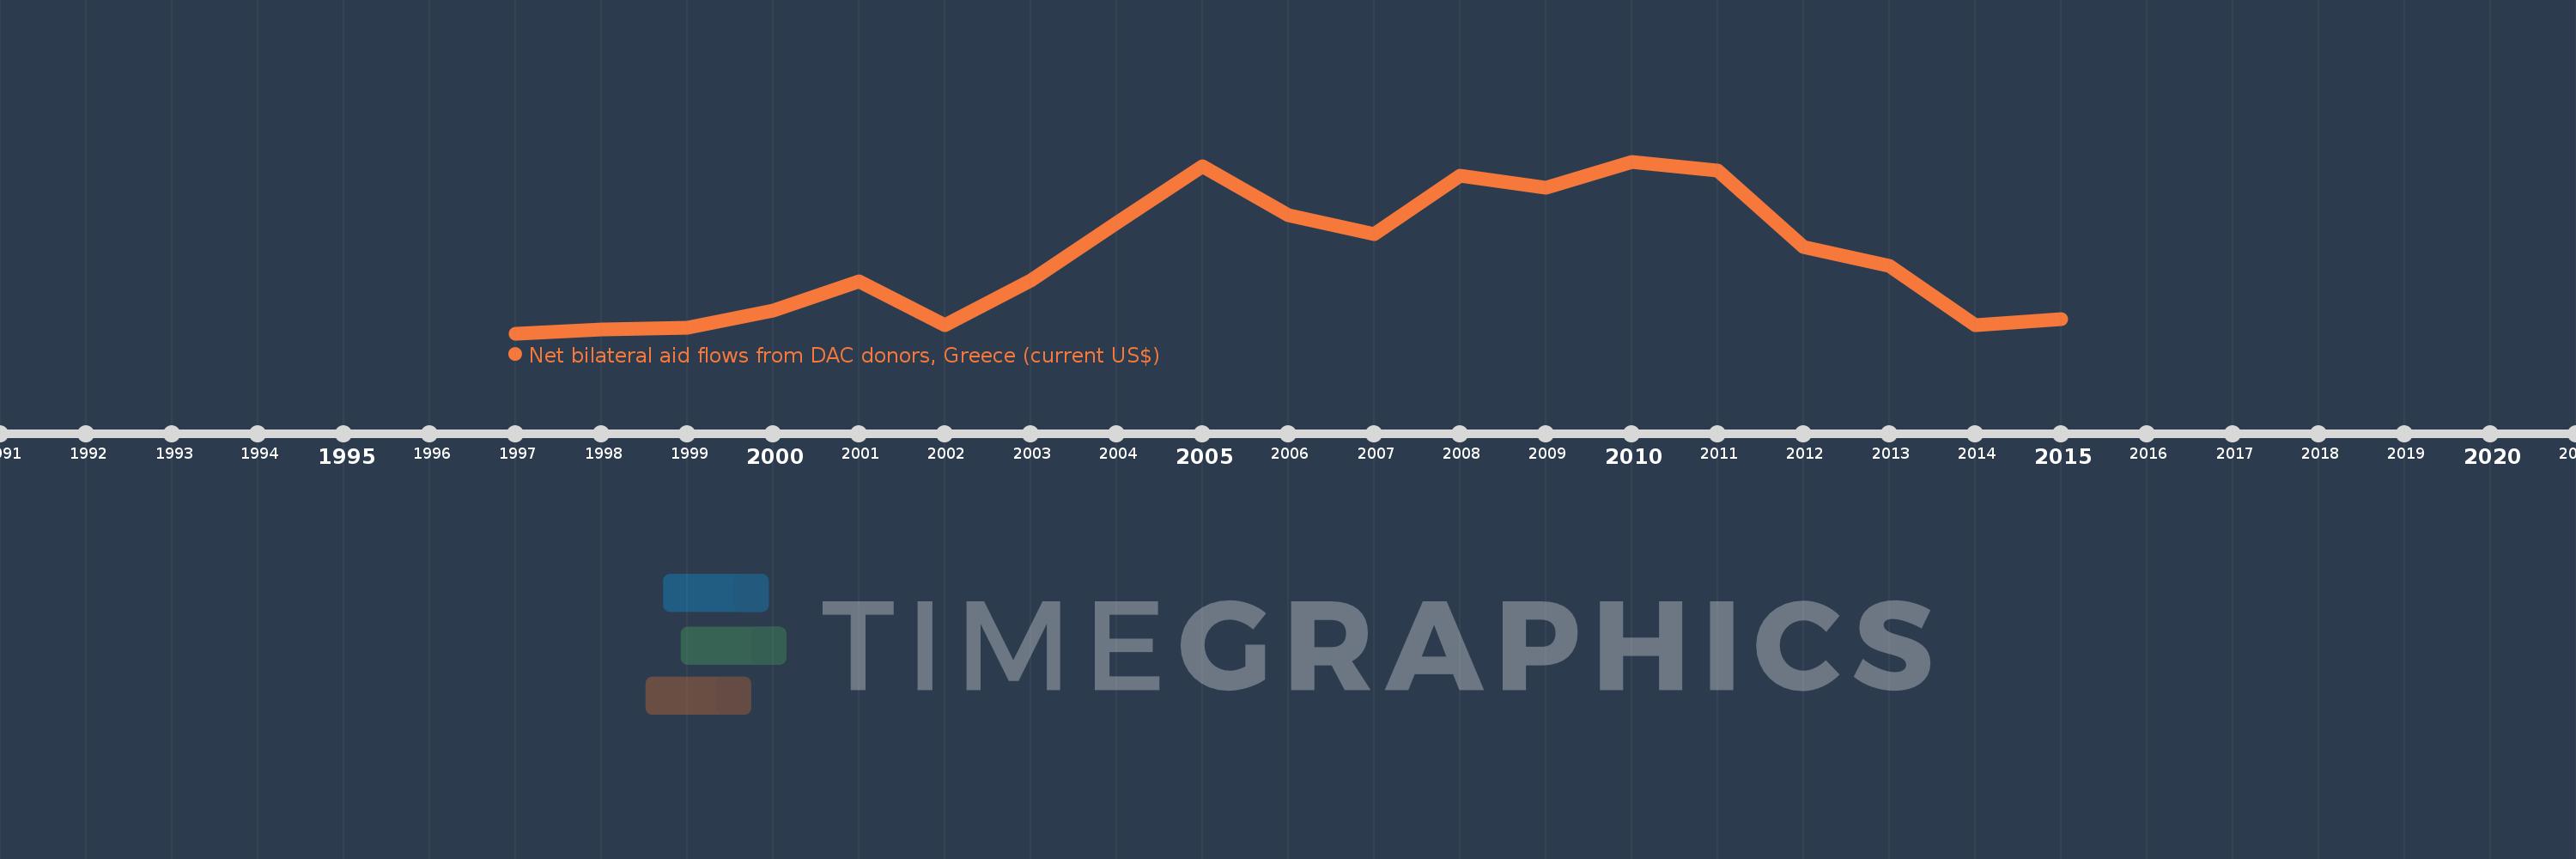
This timeline shows a graph from 1997 to 2015 of Turkey. No data until 1996. Number of actual observations by date: 19.
Source name:
World Development Indicators
Source organization:
Development Assistance Committee of the Organisation for Economic Co-operation and Development, Geographical Distribution of Financial Flows to Developing Countries, Development Co-operation Report, and International Development Statistics database. Data are available online at: www.oecd.org/dac/stats/idsonline.
Categories, topics:
Aid Effectiveness
Last updated:
apr 23, 2017
Indicators value changes by year
Meaning:
2.925 mln
Minimum:
80.0K
jan 1, 1997
Maximum:
6.47 mln
jan 1, 2010
At the date of observation
Value
Absolute change
Change from the previous value
jan 1, 1997
80.0K
+80.0K
0.0%
jan 1, 1998
210.0K
+130.0K
162.5%
jan 1, 1999
280.0K
+70.0K
33.33%
jan 1, 2000
940.0K
+660.0K
235.71%
jan 1, 2001
2.01 mln
+1.07 mln
113.83%
jan 1, 2002
390.0K
-1.62 mln
-80.6%
jan 1, 2003
2.05 mln
+1.66 mln
425.64%
jan 1, 2004
4.19 mln
+2.14 mln
104.39%
jan 1, 2005
6.28 mln
+2.09 mln
49.88%
jan 1, 2006
4.47 mln
-1.81 mln
-28.82%
jan 1, 2007
3.78 mln
-690.0K
-15.44%
jan 1, 2008
5.95 mln
+2.17 mln
57.41%
jan 1, 2009
5.49 mln
-460.0K
-7.73%
jan 1, 2010
6.47 mln
+980.0K
17.85%
jan 1, 2011
6.14 mln
-330.0K
-5.1%
jan 1, 2012
3.28 mln
-2.86 mln
-46.58%
jan 1, 2013
2.58 mln
-700.0K
-21.34%
jan 1, 2014
390.0K
-2.19 mln
-84.88%
jan 1, 2015
600.0K
+210.0K
53.85%
Ranking of countries by current statistics by years