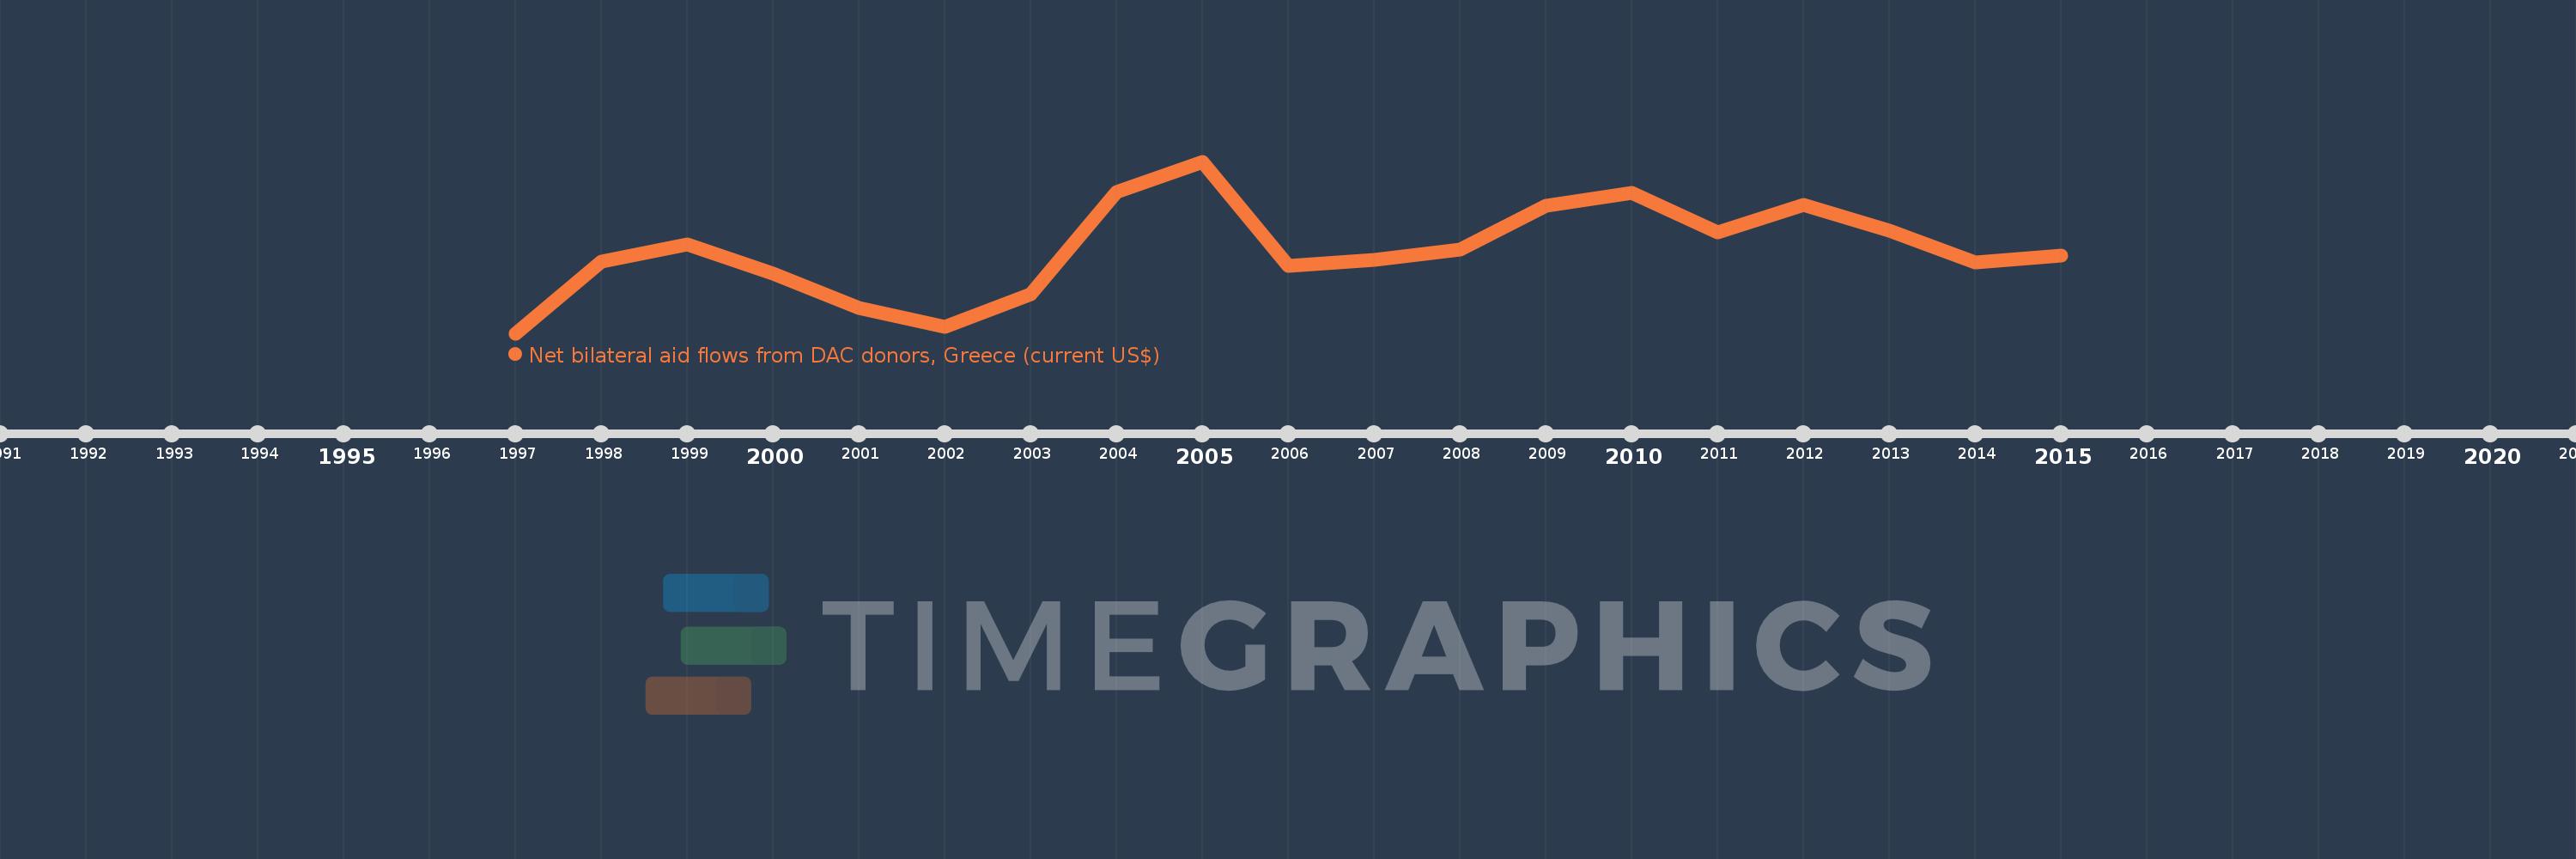
This timeline shows a graph from 1997 to 2015 of Ukraine. No data until 1996. Number of actual observations by date: 19.
Source name:
World Development Indicators
Source organization:
Development Assistance Committee of the Organisation for Economic Co-operation and Development, Geographical Distribution of Financial Flows to Developing Countries, Development Co-operation Report, and International Development Statistics database. Data are available online at: www.oecd.org/dac/stats/idsonline.
Categories, topics:
Aid Effectiveness
Last updated:
apr 23, 2017
Indicators value changes by year
Meaning:
2.484 mln
Minimum:
310.0K
jan 1, 1997
Maximum:
4.81 mln
jan 1, 2005
At the date of observation
Value
Absolute change
Change from the previous value
jan 1, 1997
310.0K
+310.0K
0.0%
jan 1, 1998
2.18 mln
+1.87 mln
603.23%
jan 1, 1999
2.64 mln
+460.0K
21.1%
jan 1, 2000
1.87 mln
-770.0K
-29.17%
jan 1, 2001
970.0K
-900.0K
-48.13%
jan 1, 2002
470.0K
-500.0K
-51.55%
jan 1, 2003
1.33 mln
+860.0K
182.98%
jan 1, 2004
4.02 mln
+2.69 mln
202.26%
jan 1, 2005
4.81 mln
+790.0K
19.65%
jan 1, 2006
2.07 mln
-2.74 mln
-56.96%
jan 1, 2007
2.23 mln
+160.0K
7.73%
jan 1, 2008
2.5 mln
+270.0K
12.11%
jan 1, 2009
3.66 mln
+1.16 mln
46.4%
jan 1, 2010
3.99 mln
+330.0K
9.02%
jan 1, 2011
2.96 mln
-1.03 mln
-25.81%
jan 1, 2012
3.68 mln
+720.0K
24.32%
jan 1, 2013
2.99 mln
-690.0K
-18.75%
jan 1, 2014
2.16 mln
-830.0K
-27.76%
jan 1, 2015
2.35 mln
+190.0K
8.8%
Ranking of countries by current statistics by years