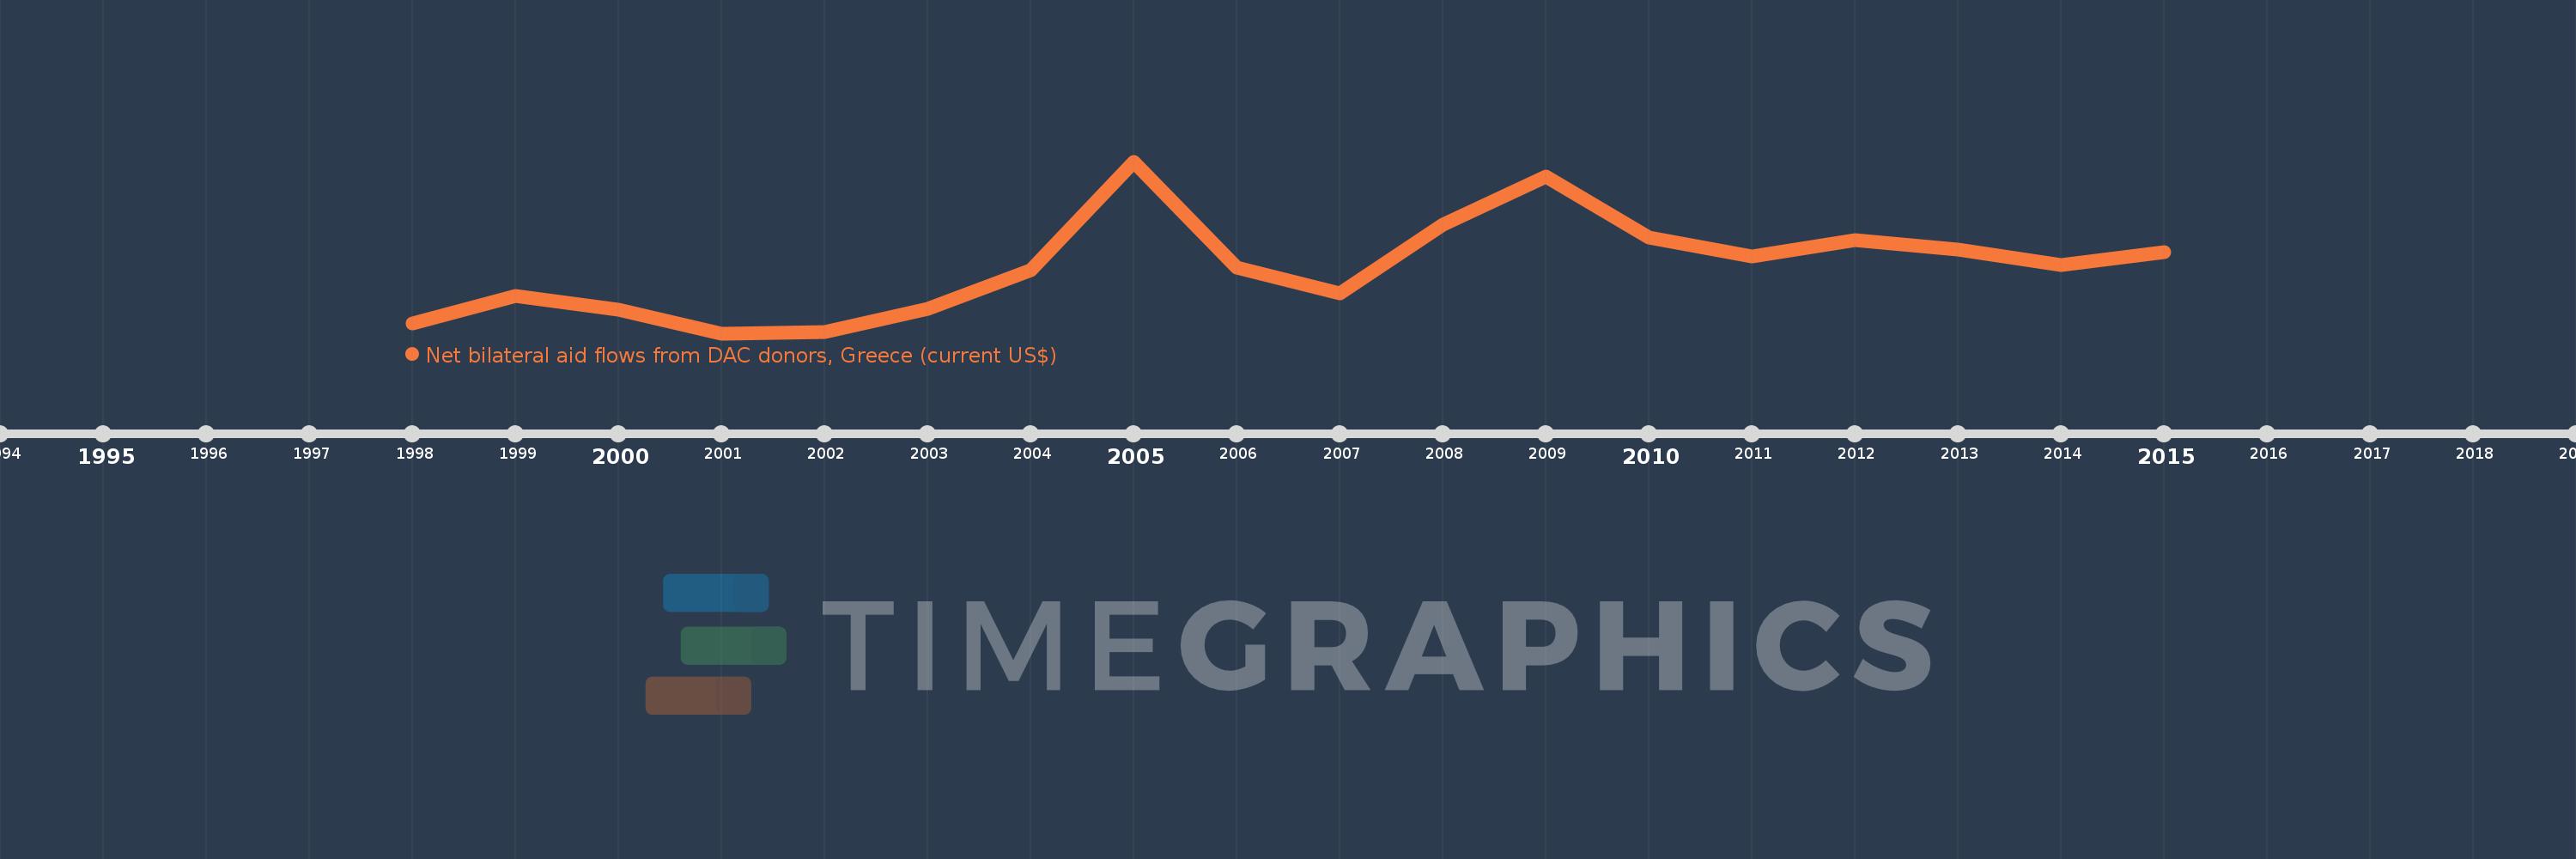
This timeline shows a graph from 1998 to 2015 of Iran, Islamic Rep.. No data until 1997. Number of actual observations by date: 18.
Source name:
World Development Indicators
Source organization:
Development Assistance Committee of the Organisation for Economic Co-operation and Development, Geographical Distribution of Financial Flows to Developing Countries, Development Co-operation Report, and International Development Statistics database. Data are available online at: www.oecd.org/dac/stats/idsonline.
Categories, topics:
Aid Effectiveness
Last updated:
apr 23, 2017
Indicators value changes by year
Meaning:
576.111K
Minimum:
90.0K
jan 1, 2001
Maximum:
1.34 mln
jan 1, 2005
At the date of observation
Value
Absolute change
Change from the previous value
jan 1, 1998
160.0K
+160.0K
0.0%
jan 1, 1999
360.0K
+200.0K
125.0%
jan 1, 2000
260.0K
-100.0K
-27.78%
jan 1, 2001
90.0K
-170.0K
-65.38%
jan 1, 2002
100.0K
+10.0K
11.11%
jan 1, 2003
270.0K
+170.0K
170.0%
jan 1, 2004
550.0K
+280.0K
103.7%
jan 1, 2005
1.34 mln
+790.0K
143.64%
jan 1, 2006
570.0K
-770.0K
-57.46%
jan 1, 2007
380.0K
-190.0K
-33.33%
jan 1, 2008
880.0K
+500.0K
131.58%
jan 1, 2009
1.23 mln
+350.0K
39.77%
jan 1, 2010
790.0K
-440.0K
-35.77%
jan 1, 2011
650.0K
-140.0K
-17.72%
jan 1, 2012
770.0K
+120.0K
18.46%
jan 1, 2013
700.0K
-70.0K
-9.09%
jan 1, 2014
590.0K
-110.0K
-15.71%
jan 1, 2015
680.0K
+90.0K
15.25%
Ranking of countries by current statistics by years