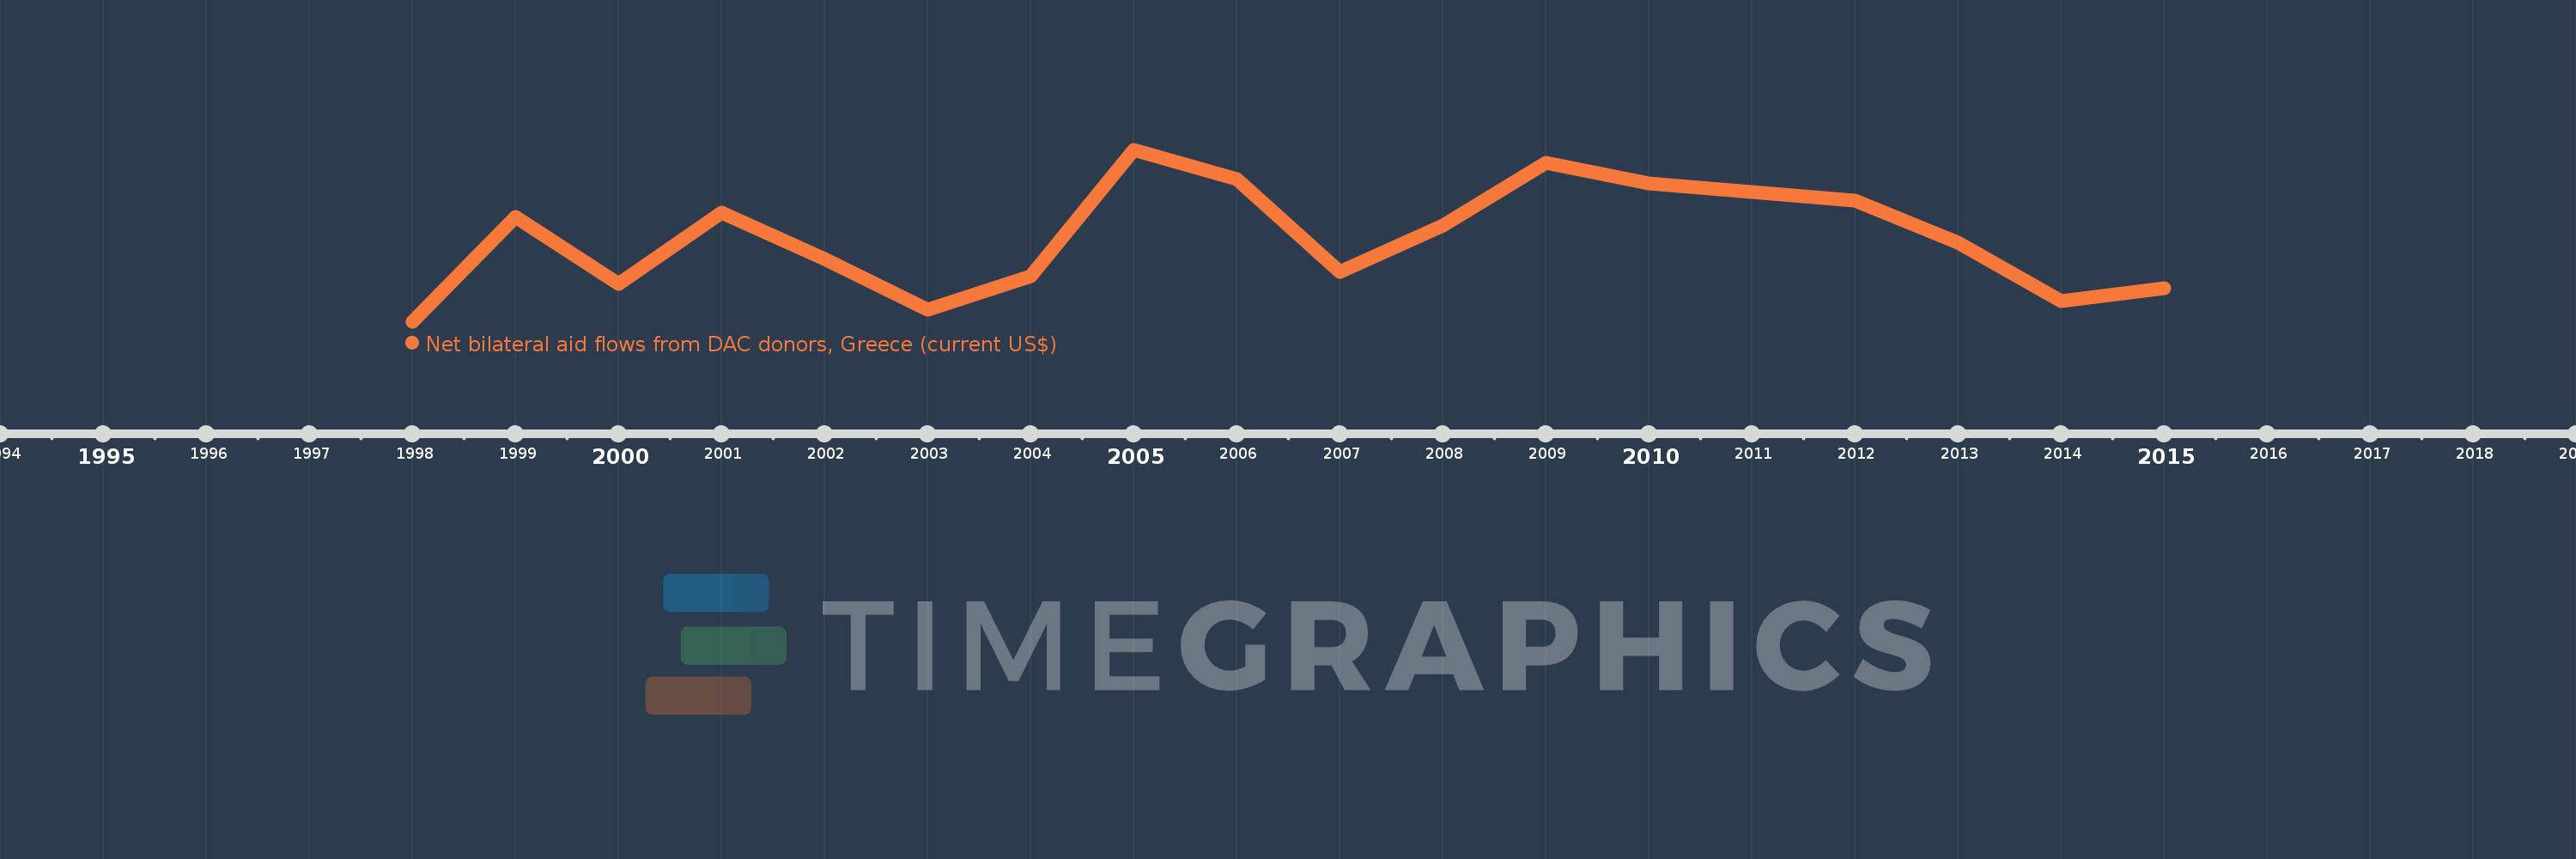
This timeline shows a graph from 1998 to 2015 of Uzbekistan. No data until 1997. Number of actual observations by date: 18.
Source name:
World Development Indicators
Source organization:
Development Assistance Committee of the Organisation for Economic Co-operation and Development, Geographical Distribution of Financial Flows to Developing Countries, Development Co-operation Report, and International Development Statistics database. Data are available online at: www.oecd.org/dac/stats/idsonline.
Categories, topics:
Aid Effectiveness
Last updated:
apr 23, 2017
Indicators value changes by year
Meaning:
261.111K
Minimum:
60.0K
jan 1, 1998
Maximum:
470.0K
jan 1, 2005
At the date of observation
Value
Absolute change
Change from the previous value
jan 1, 1998
60.0K
+60.0K
0.0%
jan 1, 1999
310.0K
+250.0K
416.67%
jan 1, 2000
150.0K
-160.0K
-51.61%
jan 1, 2001
320.0K
+170.0K
113.33%
jan 1, 2002
210.0K
-110.0K
-34.38%
jan 1, 2003
90.0K
-120.0K
-57.14%
jan 1, 2004
170.0K
+80.0K
88.89%
jan 1, 2005
470.0K
+300.0K
176.47%
jan 1, 2006
400.0K
-70.0K
-14.89%
jan 1, 2007
180.0K
-220.0K
-55.0%
jan 1, 2008
290.0K
+110.0K
61.11%
jan 1, 2009
440.0K
+150.0K
51.72%
jan 1, 2010
390.0K
-50.0K
-11.36%
jan 1, 2011
370.0K
-20.0K
-5.13%
jan 1, 2012
350.0K
-20.0K
-5.41%
jan 1, 2013
250.0K
-100.0K
-28.57%
jan 1, 2014
110.0K
-140.0K
-56.0%
jan 1, 2015
140.0K
+30.0K
27.27%
Ranking of countries by current statistics by years