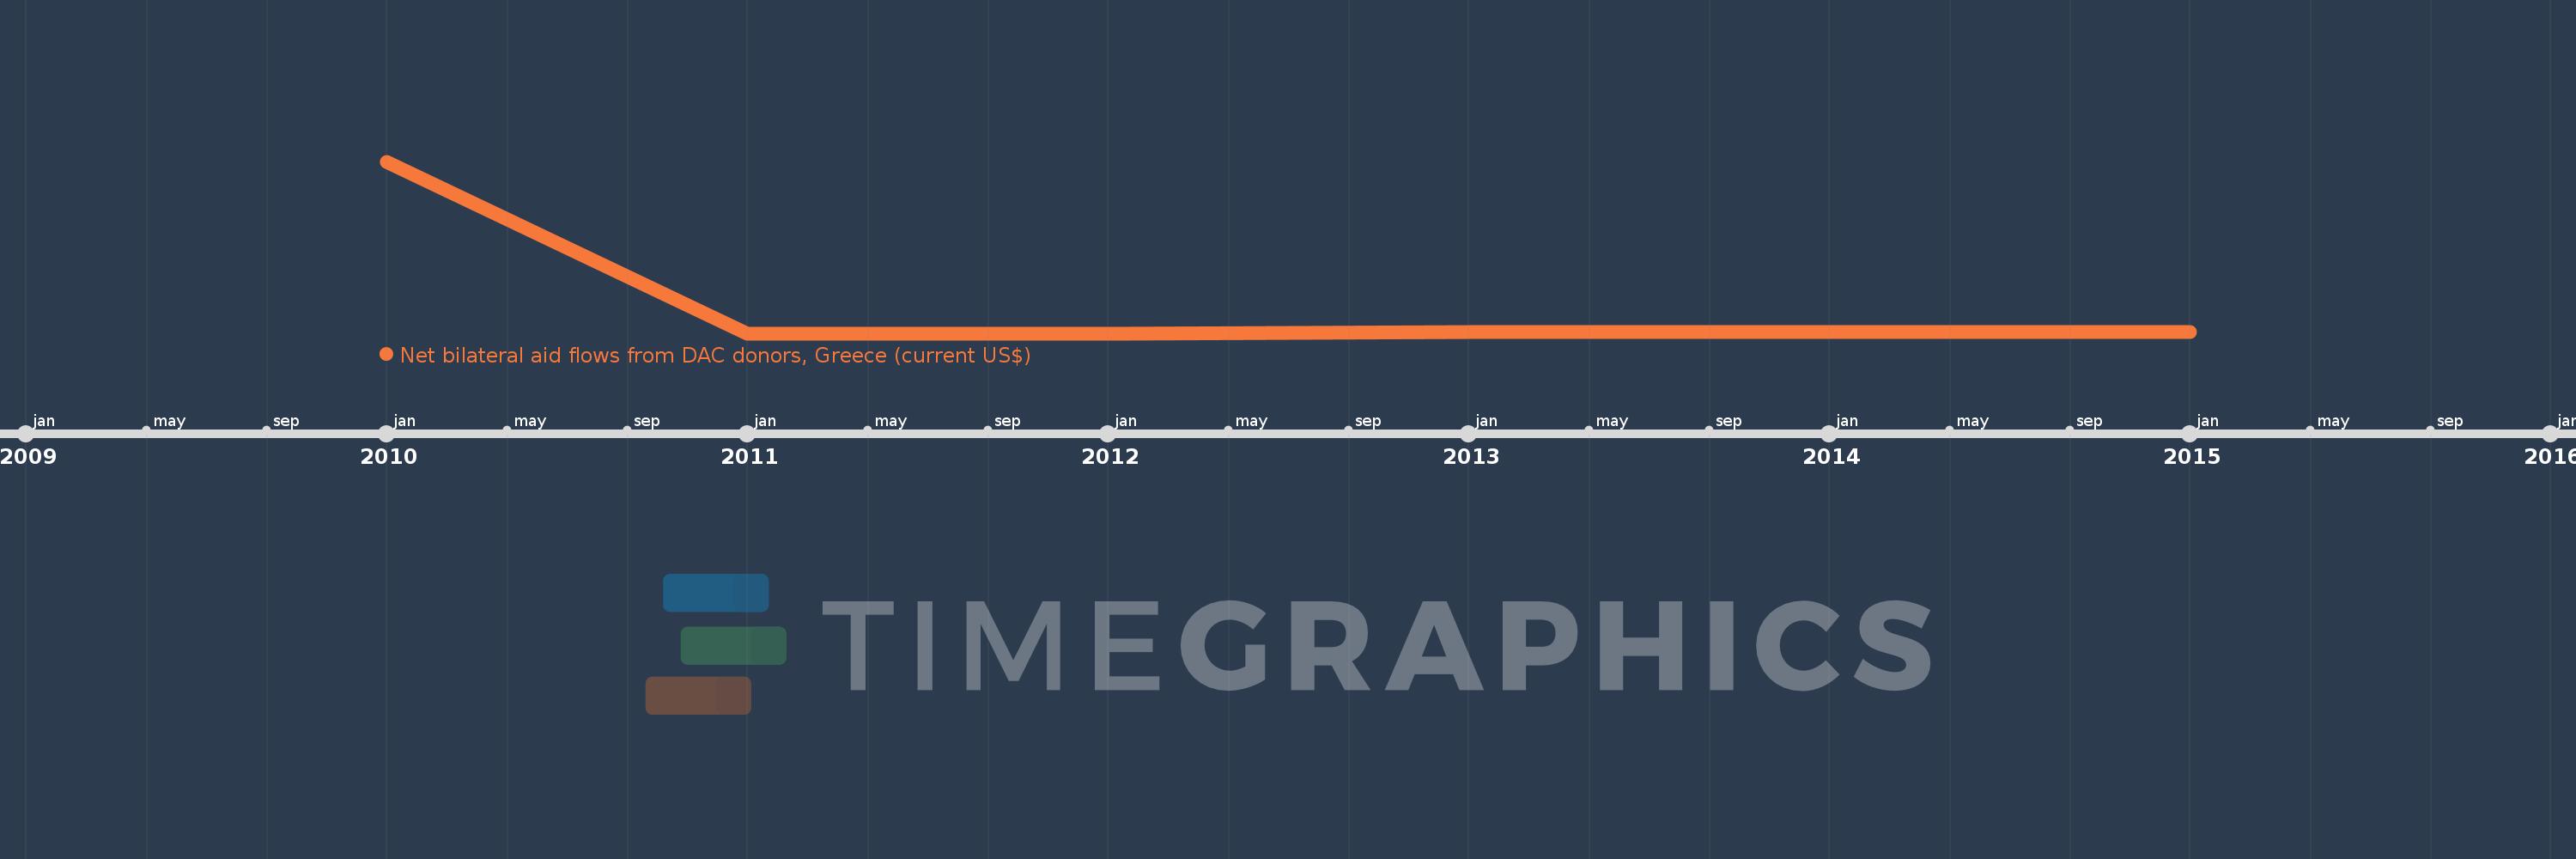
This timeline shows a graph from 2010 to 2015 of Kosovo. No data until 2009. Number of actual observations by date: 6.
Source name:
World Development Indicators
Source organization:
Development Assistance Committee of the Organisation for Economic Co-operation and Development, Geographical Distribution of Financial Flows to Developing Countries, Development Co-operation Report, and International Development Statistics database. Data are available online at: www.oecd.org/dac/stats/idsonline.
Categories, topics:
Aid Effectiveness
Last updated:
apr 23, 2017
Indicators value changes by year
Meaning:
5.602 mln
Minimum:
30.0K
jan 1, 2011
Maximum:
32.76 mln
jan 1, 2010
At the date of observation
Value
Absolute change
Change from the previous value
jan 1, 2010
32.76 mln
+32.76 mln
0.0%
jan 1, 2011
30.0K
-32.73 mln
-99.91%
jan 1, 2012
30.0K
0.0
0.0%
jan 1, 2013
310.0K
+280.0K
933.33%
jan 1, 2014
240.0K
-70.0K
-22.58%
jan 1, 2015
240.0K
0.0
0.0%
Ranking of countries by current statistics by years