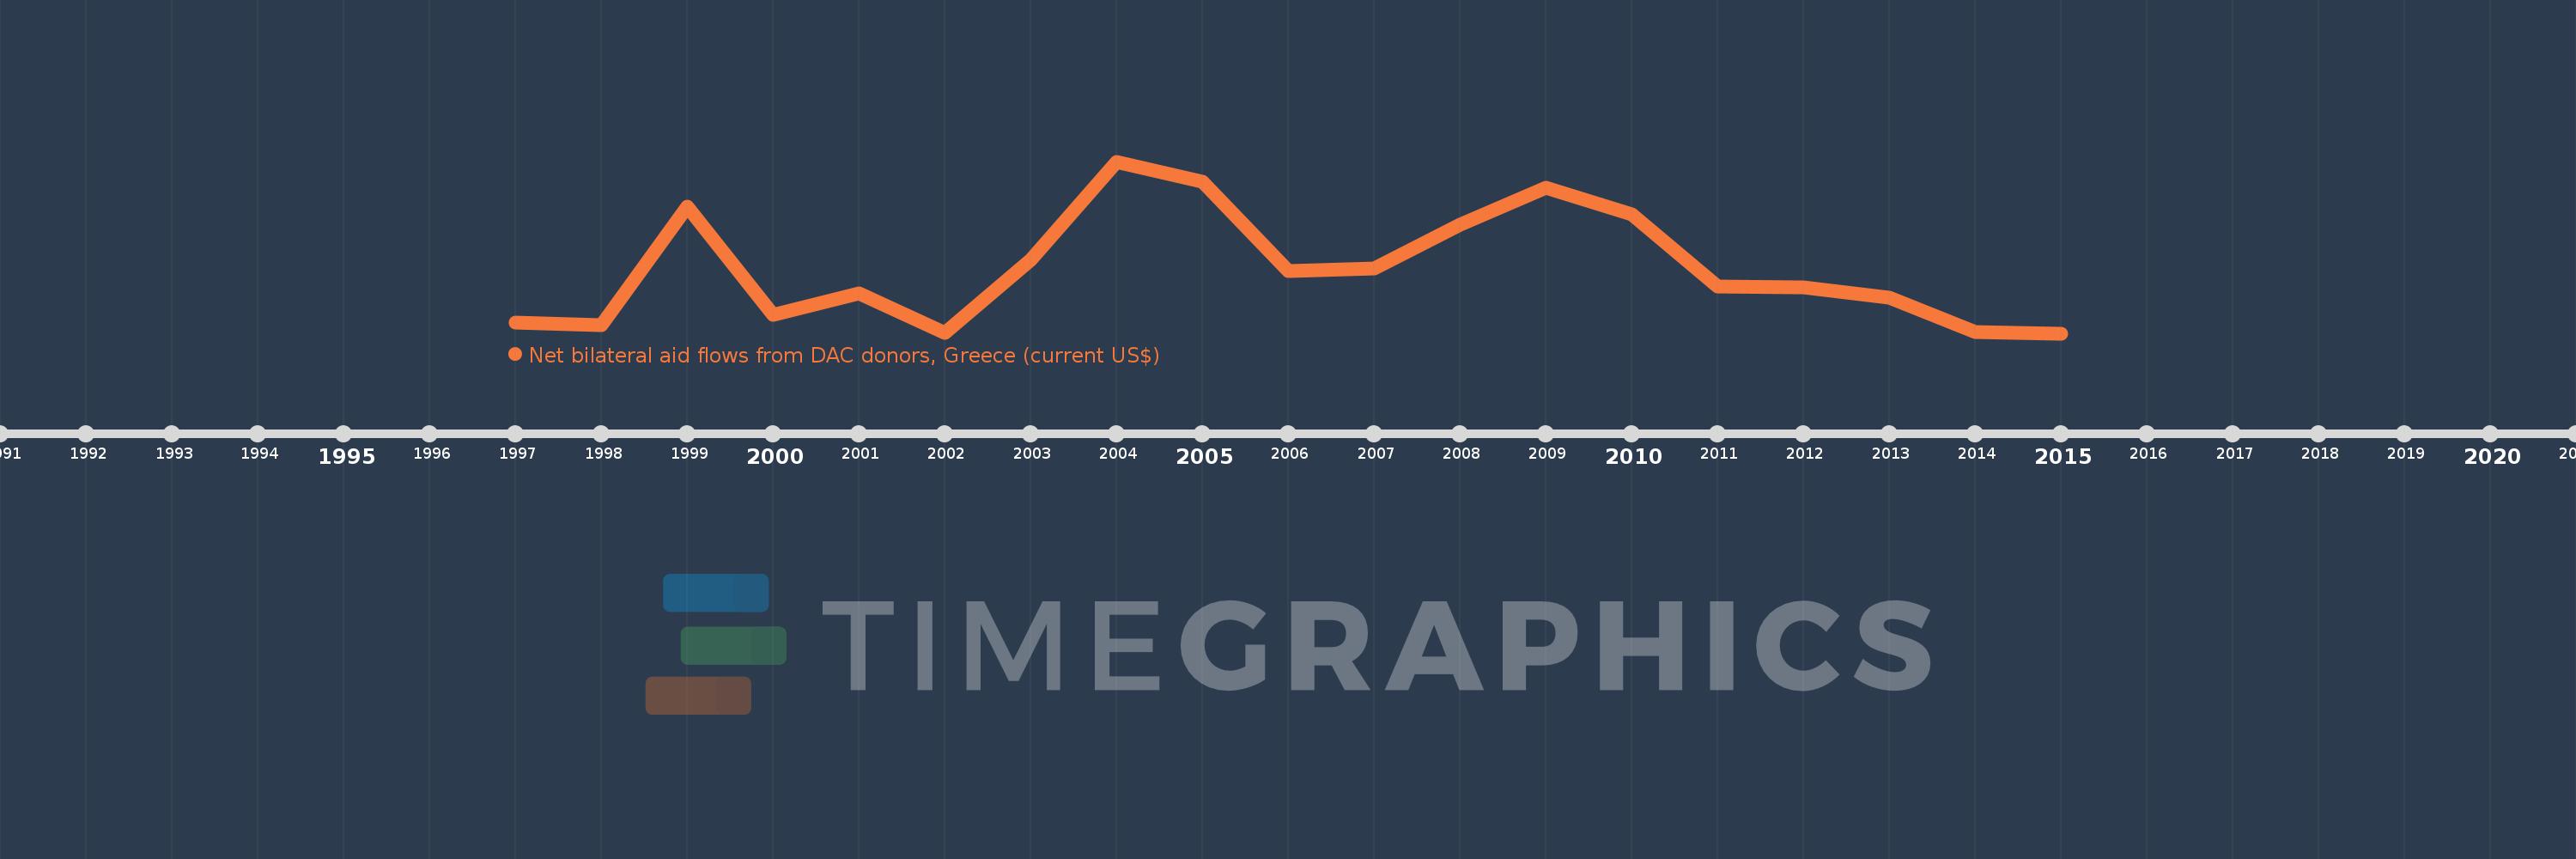
This timeline shows a graph from 1997 to 2015 of Georgia. No data until 1996. Number of actual observations by date: 19.
Source name:
World Development Indicators
Source organization:
Development Assistance Committee of the Organisation for Economic Co-operation and Development, Geographical Distribution of Financial Flows to Developing Countries, Development Co-operation Report, and International Development Statistics database. Data are available online at: www.oecd.org/dac/stats/idsonline.
Categories, topics:
Aid Effectiveness
Last updated:
apr 23, 2017
Indicators value changes by year
Meaning:
2.197 mln
Minimum:
380.0K
jan 1, 2015
Maximum:
5.2 mln
jan 1, 2004
At the date of observation
Value
Absolute change
Change from the previous value
jan 1, 1997
670.0K
+670.0K
0.0%
jan 1, 1998
620.0K
-50.0K
-7.46%
jan 1, 1999
3.93 mln
+3.31 mln
533.87%
jan 1, 2000
890.0K
-3.04 mln
-77.35%
jan 1, 2001
1.5 mln
+610.0K
68.54%
jan 1, 2002
390.0K
-1.11 mln
-74.0%
jan 1, 2003
2.44 mln
+2.05 mln
525.64%
jan 1, 2004
5.2 mln
+2.76 mln
113.11%
jan 1, 2005
4.63 mln
-570.0K
-10.96%
jan 1, 2006
2.13 mln
-2.5 mln
-54.0%
jan 1, 2007
2.2 mln
+70.0K
3.29%
jan 1, 2008
3.43 mln
+1.23 mln
55.91%
jan 1, 2009
4.47 mln
+1.04 mln
30.32%
jan 1, 2010
3.71 mln
-760.0K
-17.0%
jan 1, 2011
1.7 mln
-2.01 mln
-54.18%
jan 1, 2012
1.66 mln
-40.0K
-2.35%
jan 1, 2013
1.38 mln
-280.0K
-16.87%
jan 1, 2014
420.0K
-960.0K
-69.57%
jan 1, 2015
380.0K
-40.0K
-9.52%
Ranking of countries by current statistics by years