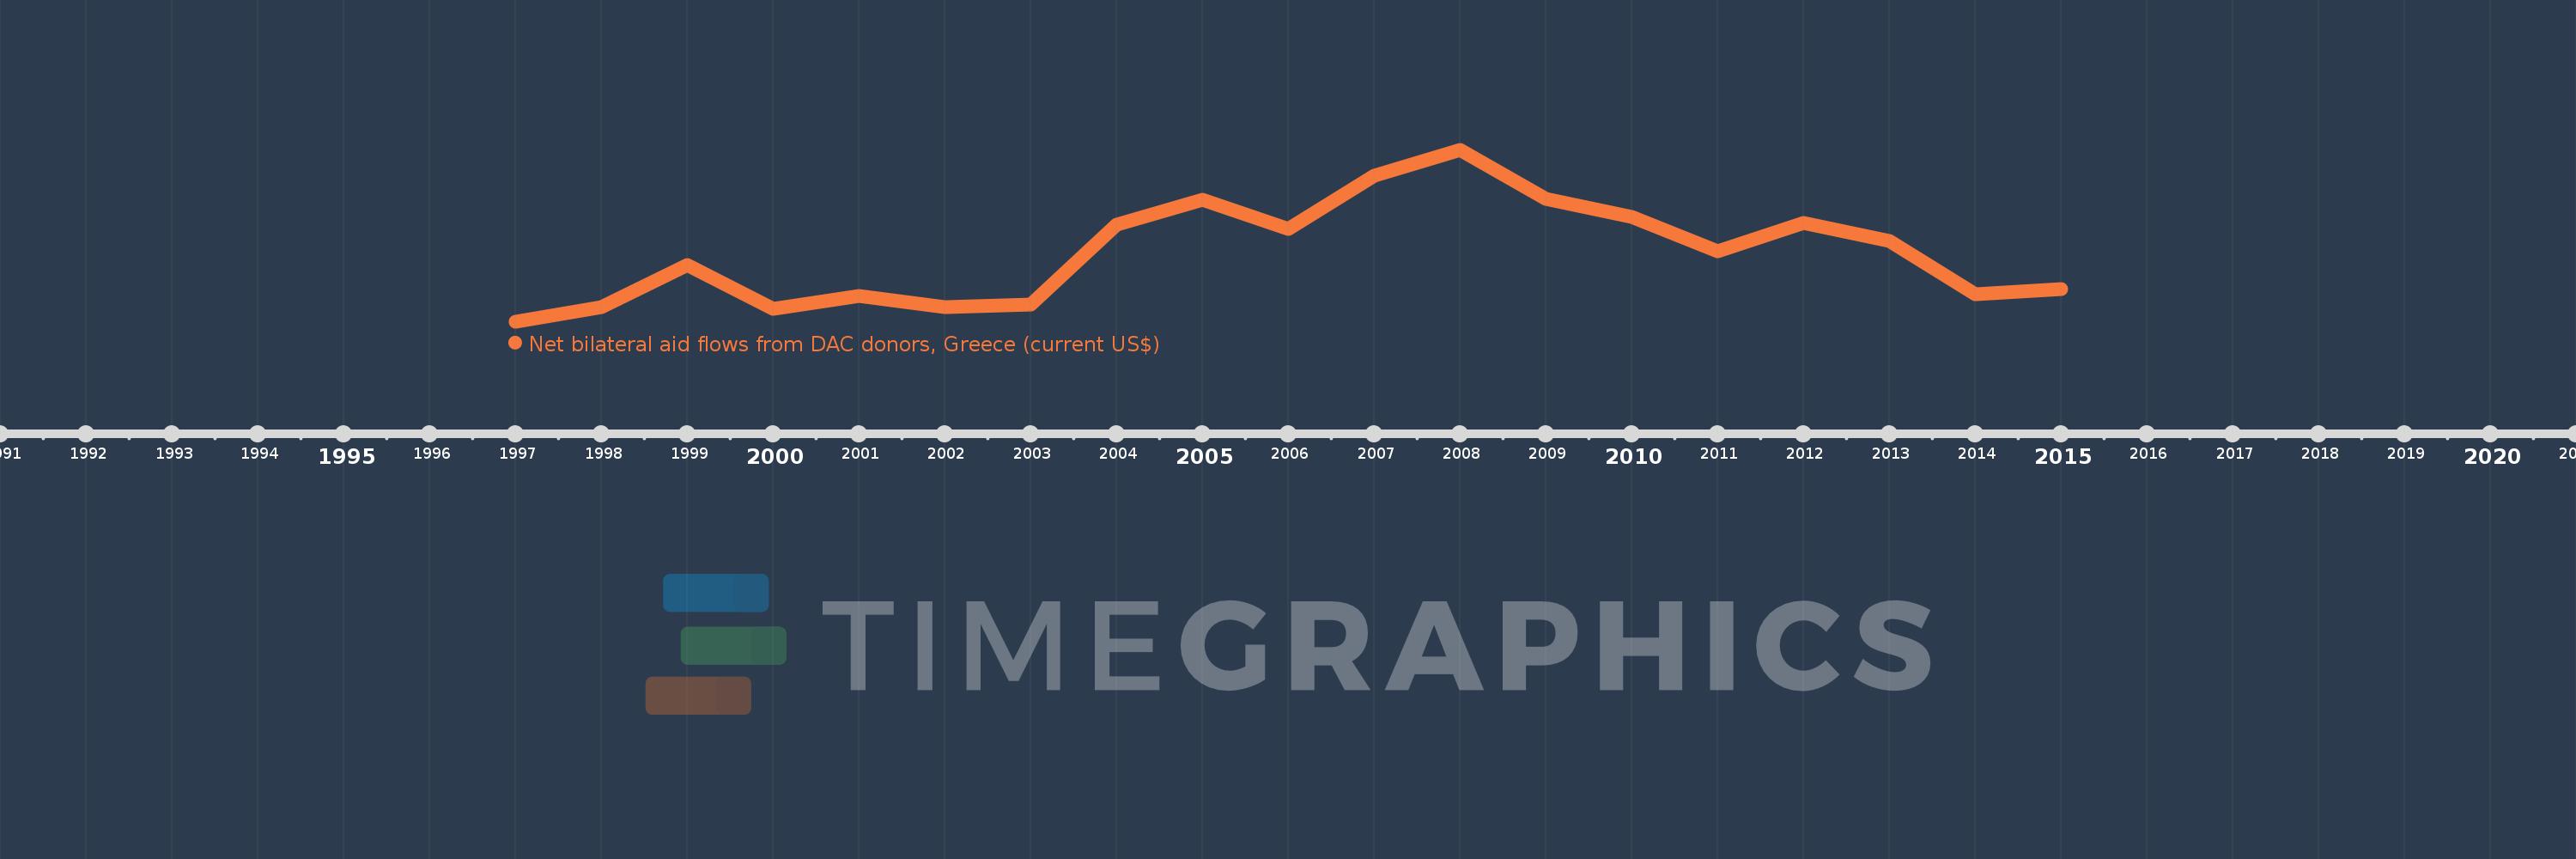
This timeline shows a graph from 1997 to 2015 of Moldova. No data until 1996. Number of actual observations by date: 19.
Source name:
World Development Indicators
Source organization:
Development Assistance Committee of the Organisation for Economic Co-operation and Development, Geographical Distribution of Financial Flows to Developing Countries, Development Co-operation Report, and International Development Statistics database. Data are available online at: www.oecd.org/dac/stats/idsonline.
Categories, topics:
Aid Effectiveness
Last updated:
apr 23, 2017
Indicators value changes by year
Meaning:
1.189 mln
Minimum:
10.0K
jan 1, 1997
Maximum:
2.94 mln
jan 1, 2008
At the date of observation
Value
Absolute change
Change from the previous value
jan 1, 1997
10.0K
+10.0K
0.0%
jan 1, 1998
260.0K
+250.0K
2.5K%
jan 1, 1999
980.0K
+720.0K
276.92%
jan 1, 2000
230.0K
-750.0K
-76.53%
jan 1, 2001
460.0K
+230.0K
100.0%
jan 1, 2002
270.0K
-190.0K
-41.3%
jan 1, 2003
310.0K
+40.0K
14.81%
jan 1, 2004
1.67 mln
+1.36 mln
438.71%
jan 1, 2005
2.09 mln
+420.0K
25.15%
jan 1, 2006
1.59 mln
-500.0K
-23.92%
jan 1, 2007
2.51 mln
+920.0K
57.86%
jan 1, 2008
2.94 mln
+430.0K
17.13%
jan 1, 2009
2.11 mln
-830.0K
-28.23%
jan 1, 2010
1.8 mln
-310.0K
-14.69%
jan 1, 2011
1.21 mln
-590.0K
-32.78%
jan 1, 2012
1.7 mln
+490.0K
40.5%
jan 1, 2013
1.39 mln
-310.0K
-18.24%
jan 1, 2014
490.0K
-900.0K
-64.75%
jan 1, 2015
570.0K
+80.0K
16.33%
Ranking of countries by current statistics by years