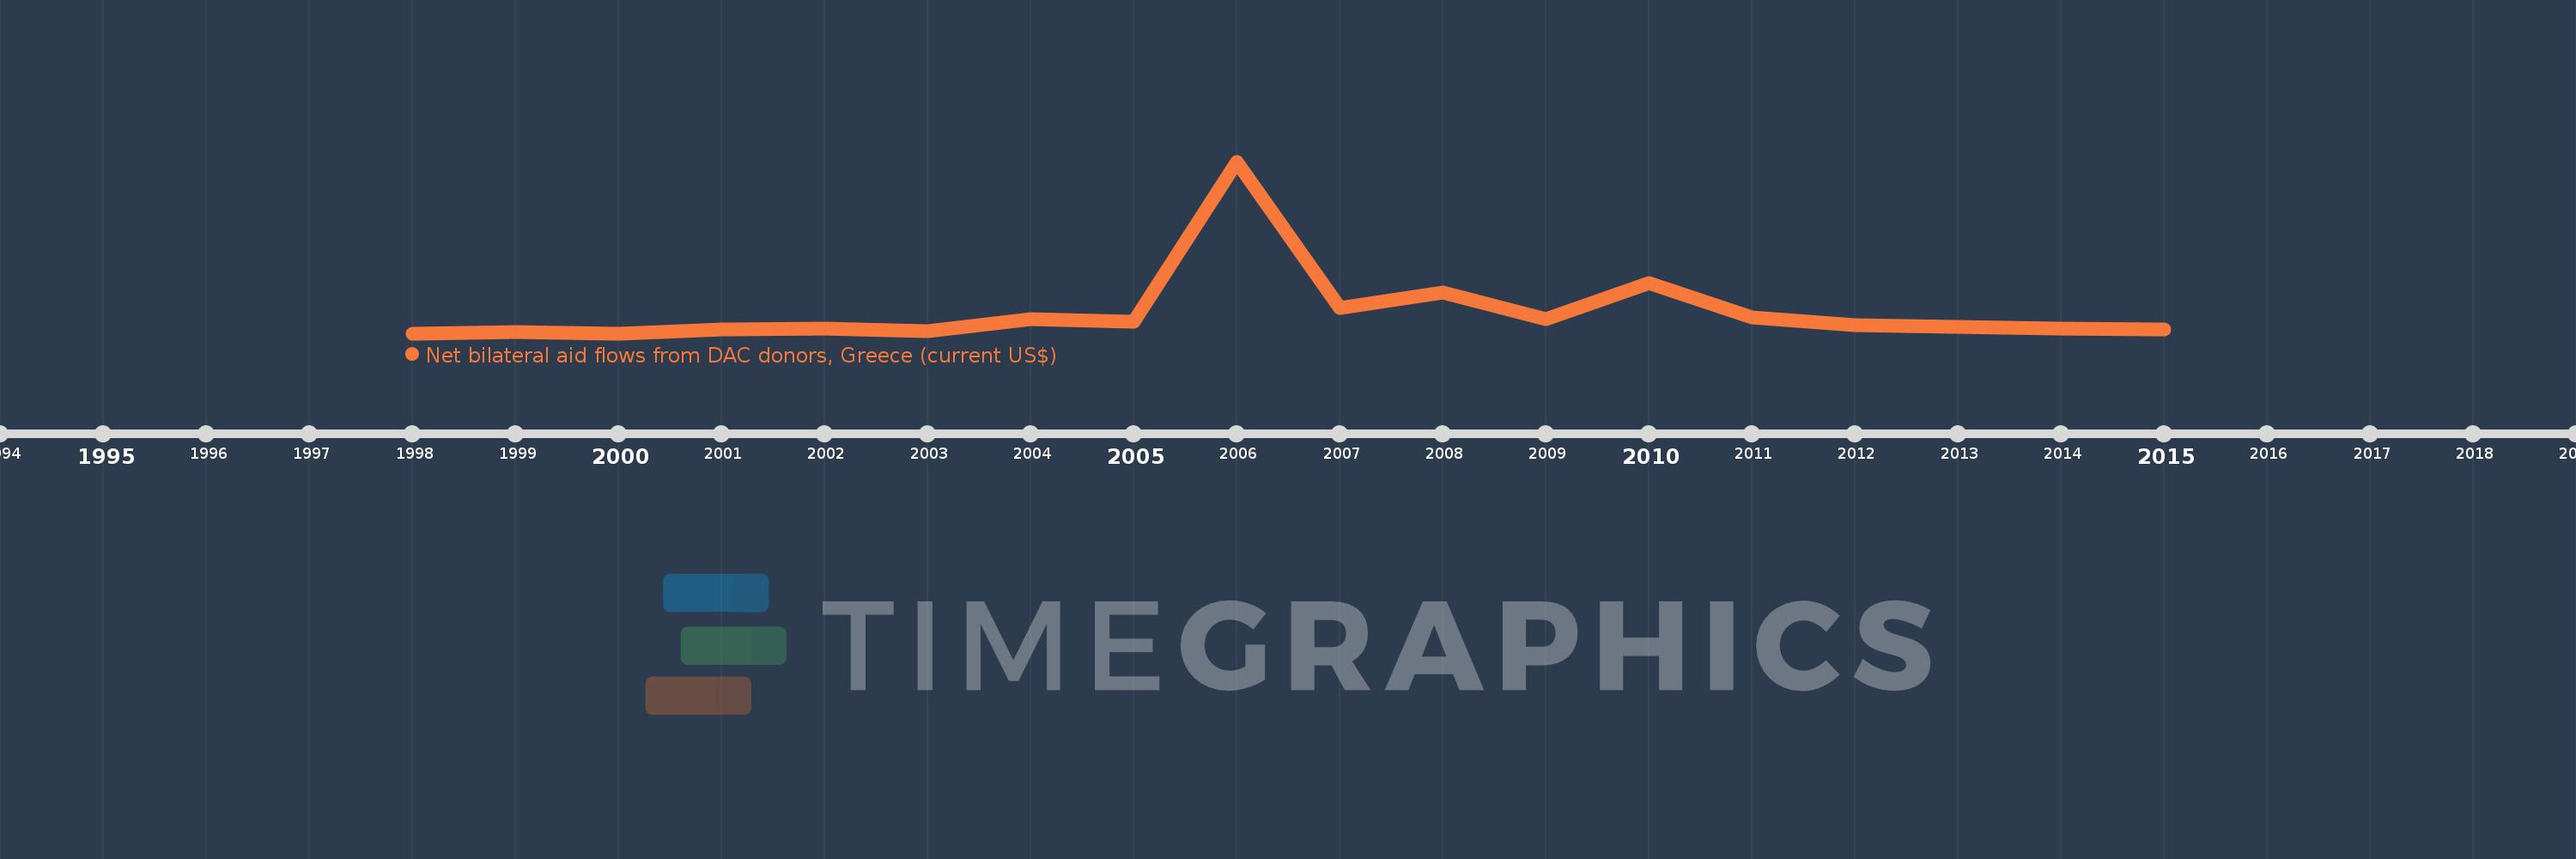
This timeline shows a graph from 1998 to 2015 of Pakistan. No data until 1997. Number of actual observations by date: 18.
Source name:
World Development Indicators
Source organization:
Development Assistance Committee of the Organisation for Economic Co-operation and Development, Geographical Distribution of Financial Flows to Developing Countries, Development Co-operation Report, and International Development Statistics database. Data are available online at: www.oecd.org/dac/stats/idsonline.
Categories, topics:
Aid Effectiveness
Last updated:
apr 23, 2017
Indicators value changes by year
Meaning:
493.333K
Minimum:
30.0K
jan 1, 1998
Maximum:
3.81 mln
jan 1, 2006
At the date of observation
Value
Absolute change
Change from the previous value
jan 1, 1998
30.0K
+30.0K
0.0%
jan 1, 1999
50.0K
+20.0K
66.67%
jan 1, 2000
30.0K
-20.0K
-40.0%
jan 1, 2001
110.0K
+80.0K
266.67%
jan 1, 2002
140.0K
+30.0K
27.27%
jan 1, 2003
70.0K
-70.0K
-50.0%
jan 1, 2004
340.0K
+270.0K
385.71%
jan 1, 2005
280.0K
-60.0K
-17.65%
jan 1, 2006
3.81 mln
+3.53 mln
1.26K%
jan 1, 2007
590.0K
-3.22 mln
-84.51%
jan 1, 2008
930.0K
+340.0K
57.63%
jan 1, 2009
340.0K
-590.0K
-63.44%
jan 1, 2010
1.14 mln
+800.0K
235.29%
jan 1, 2011
380.0K
-760.0K
-66.67%
jan 1, 2012
210.0K
-170.0K
-44.74%
jan 1, 2013
180.0K
-30.0K
-14.29%
jan 1, 2014
130.0K
-50.0K
-27.78%
jan 1, 2015
120.0K
-10.0K
-7.69%
Ranking of countries by current statistics by years