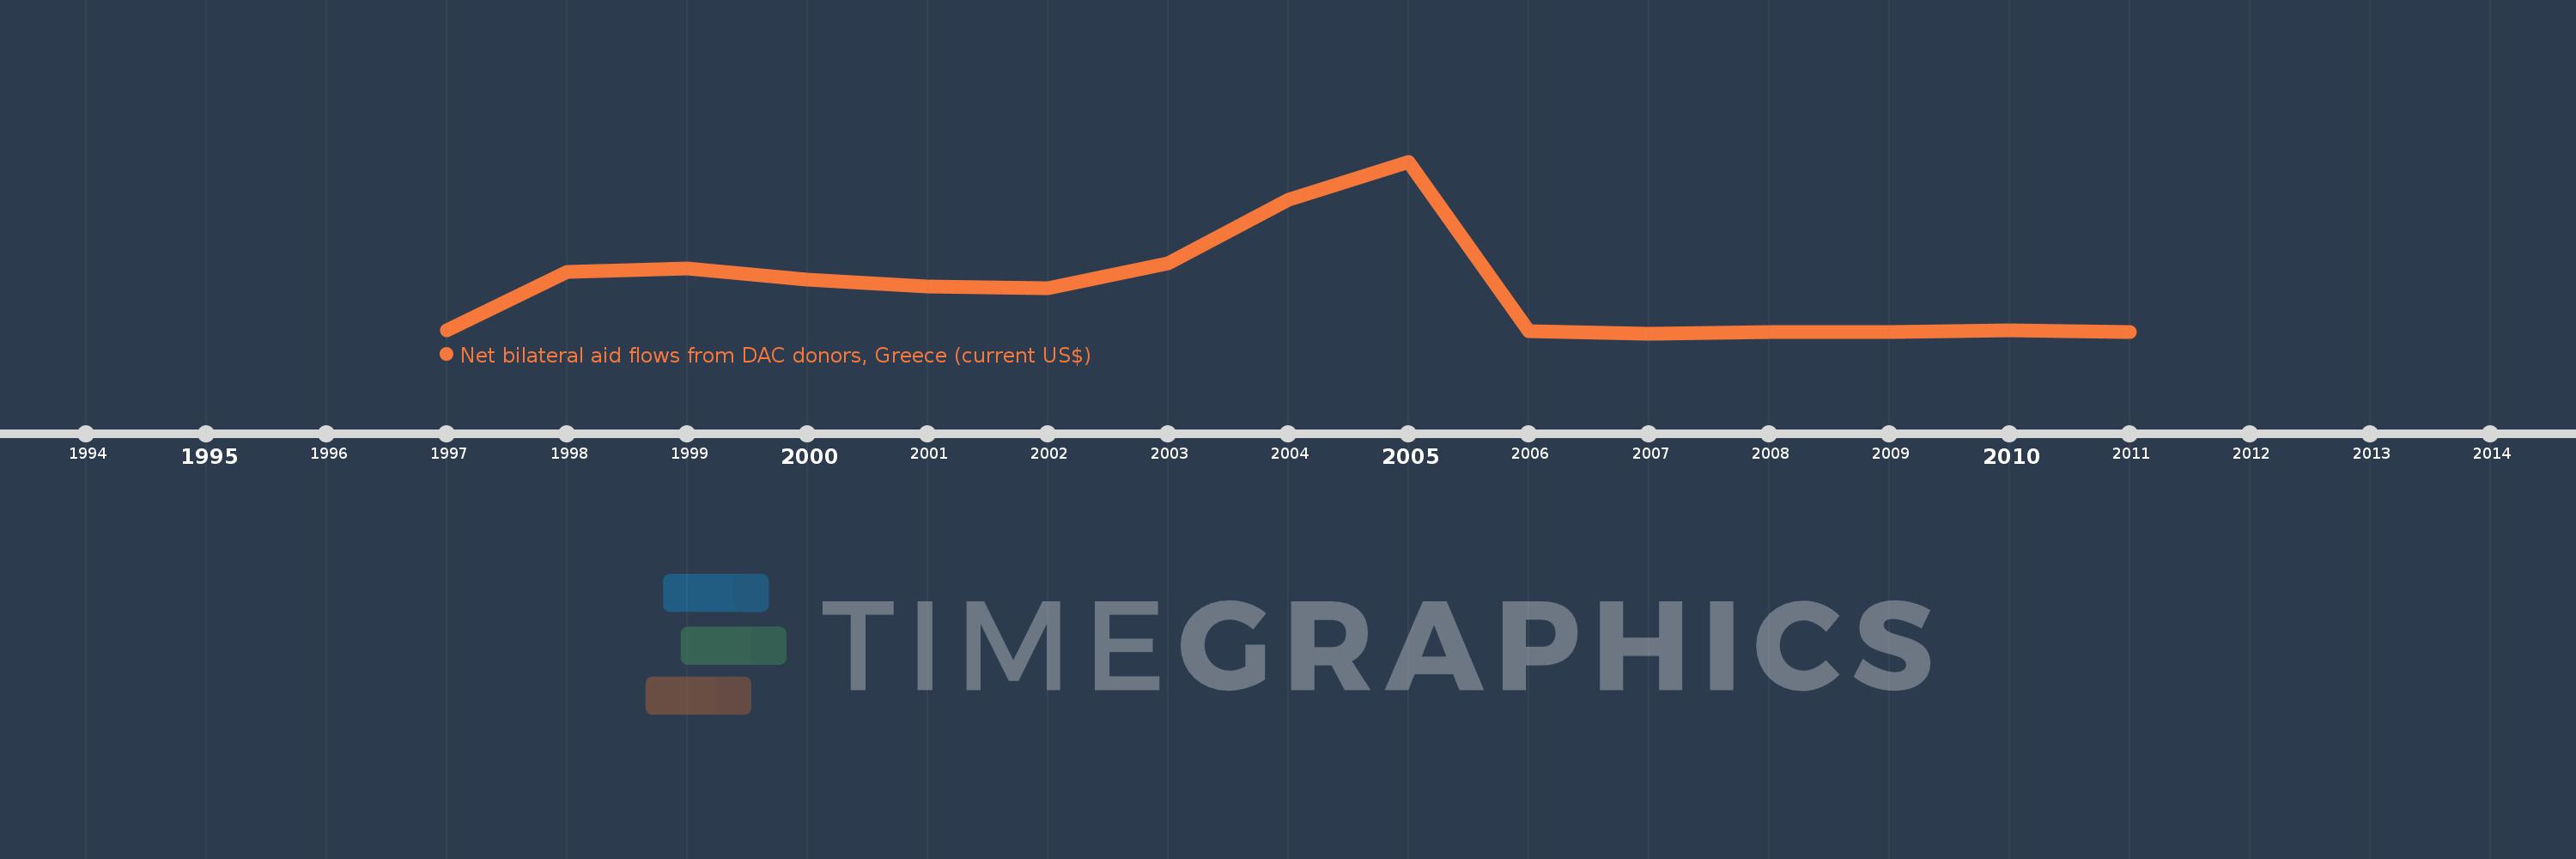
This timeline shows a graph from 1997 to 2011 of Central Europe and the Baltics. No data until 1996. Number of actual observations by date: 15.
Source name:
World Development Indicators
Source organization:
Development Assistance Committee of the Organisation for Economic Co-operation and Development, Geographical Distribution of Financial Flows to Developing Countries, Development Co-operation Report, and International Development Statistics database. Data are available online at: www.oecd.org/dac/stats/idsonline.
Categories, topics:
Aid Effectiveness
Last updated:
apr 23, 2017
Indicators value changes by year
Meaning:
3.828 mln
Minimum:
120.0K
jan 1, 2007
Maximum:
14.62 mln
jan 1, 2005
At the date of observation
Value
Absolute change
Change from the previous value
jan 1, 1997
350.0K
+350.0K
0.0%
jan 1, 1998
5.33 mln
+4.98 mln
1.42K%
jan 1, 1999
5.6 mln
+270.0K
5.07%
jan 1, 2000
4.68 mln
-920.0K
-16.43%
jan 1, 2001
4.09 mln
-590.0K
-12.61%
jan 1, 2002
3.94 mln
-150.0K
-3.67%
jan 1, 2003
6.04 mln
+2.1 mln
53.3%
jan 1, 2004
11.42 mln
+5.38 mln
89.07%
jan 1, 2005
14.62 mln
+3.2 mln
28.02%
jan 1, 2006
270.0K
-14.35 mln
-98.15%
jan 1, 2007
120.0K
-150.0K
-55.56%
jan 1, 2008
210.0K
+90.0K
75.0%
jan 1, 2009
200.0K
-10.0K
-4.76%
jan 1, 2010
340.0K
+140.0K
70.0%
jan 1, 2011
210.0K
-130.0K
-38.24%
Ranking of countries by current statistics by years