29
/
en
AIzaSyAYiBZKx7MnpbEhh9jyipgxe19OcubqV5w
April 1, 2024
99533
Cameroon
CMR
true
2
1
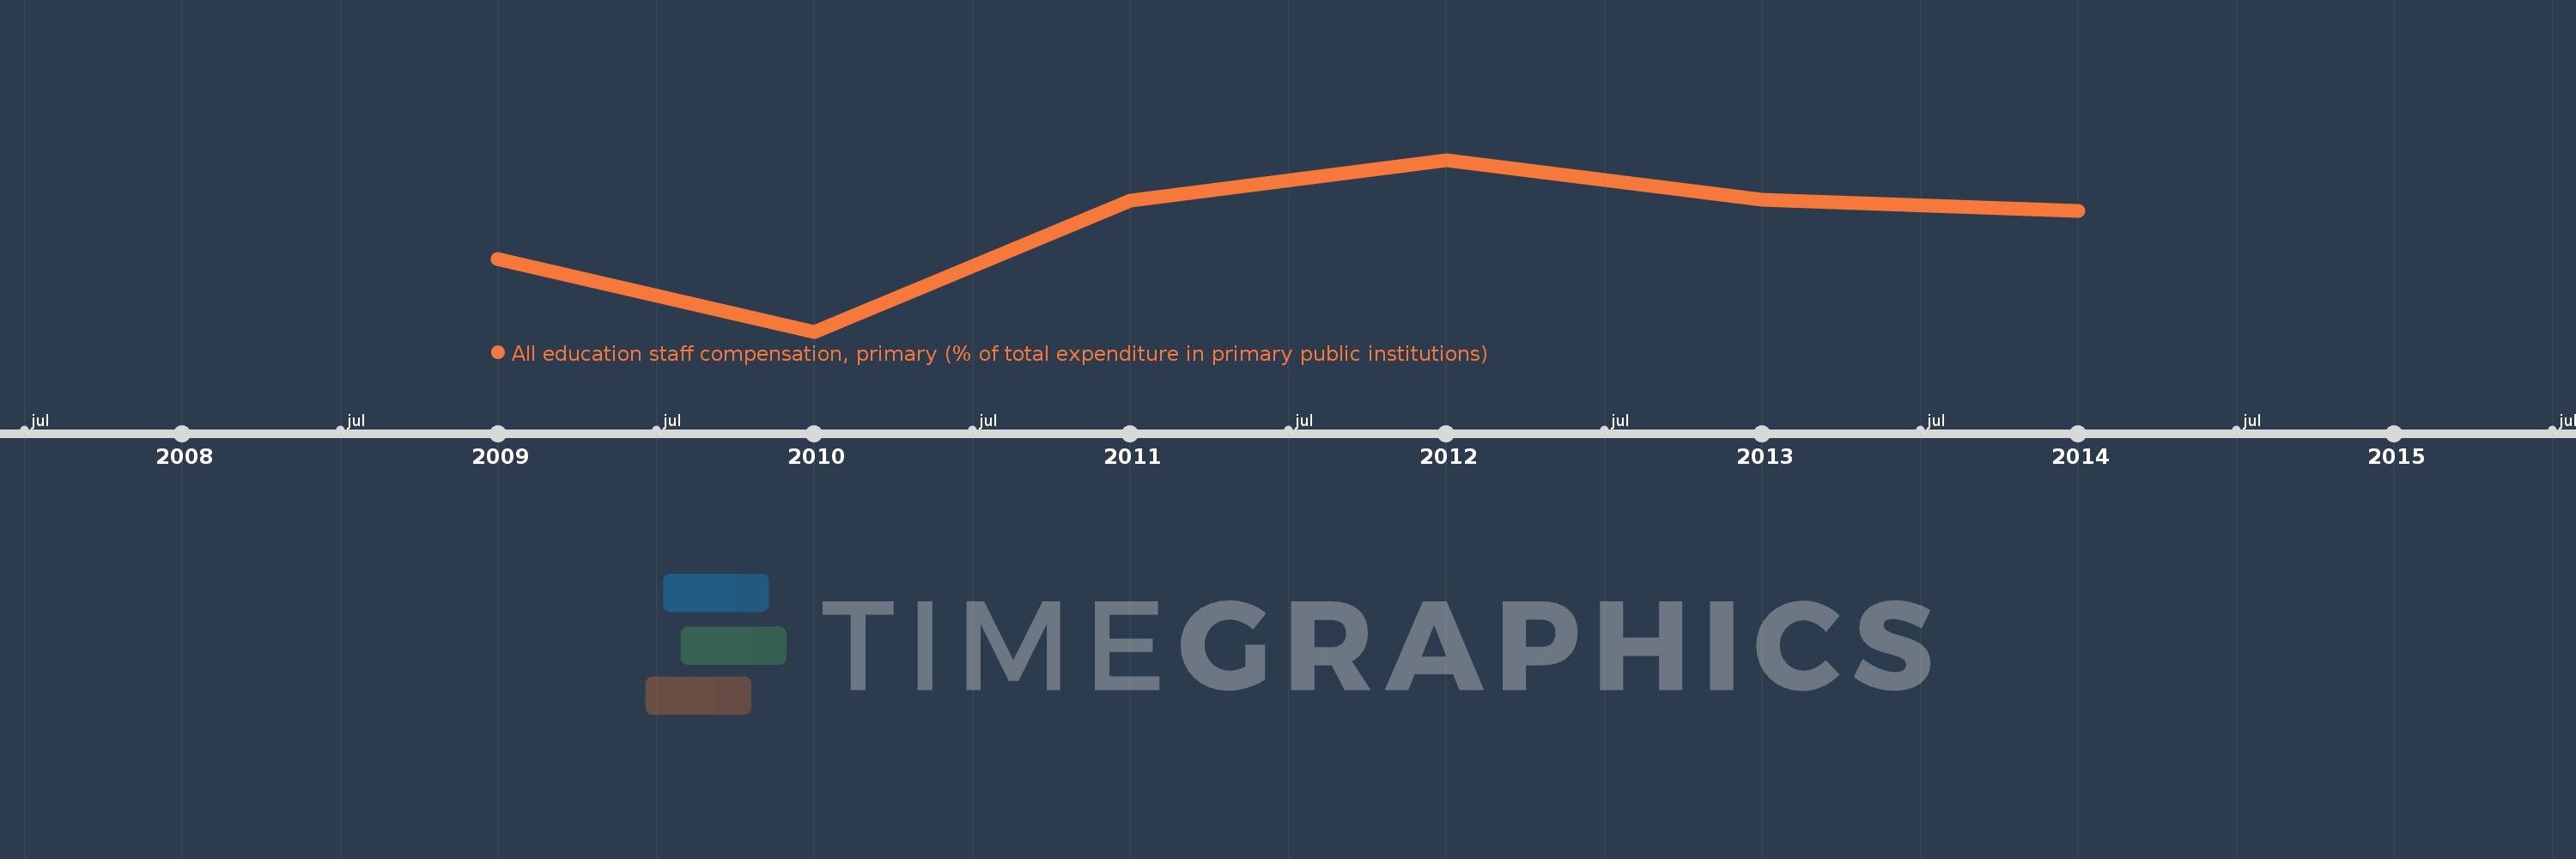
All education staff compensation, primary (% of total expenditure in primary public institutions)
2014,2013,2012,2011,2010,2009
This statistics in other country:
Timeline:
This timeline shows a graph from 2009 to 2014 of Cameroon. No data until 2008. Number of actual observations by date: 6.
Source name:
World Development Indicators
Source organization:
United Nations Educational, Scientific, and Cultural Organization (UNESCO) Institute for Statistics.
Categories, topics:
Education
Last updated:
apr 23, 2017
Indicators value changes by year
Minimum:
62.146
jan 1, 2010
Maximum:
85.908
jan 1, 2012
At the date of observation
Value
Absolute change
Change from previous value
jan 1, 2009
72.236
+72.236
0.0%
jan 1, 2010
62.146
-10.091
-13.97%
jan 1, 2011
80.246
+18.1
29.13%
jan 1, 2012
85.908
+5.662
7.06%
jan 1, 2013
80.396
-5.512
-6.42%
jan 1, 2014
78.869
-1.526
-1.9%
Ranking of countries by current statistics by years


Comments: