29
/
en
AIzaSyAYiBZKx7MnpbEhh9jyipgxe19OcubqV5w
April 1, 2024
92041
British Virgin Islands
VGB
true
2
1
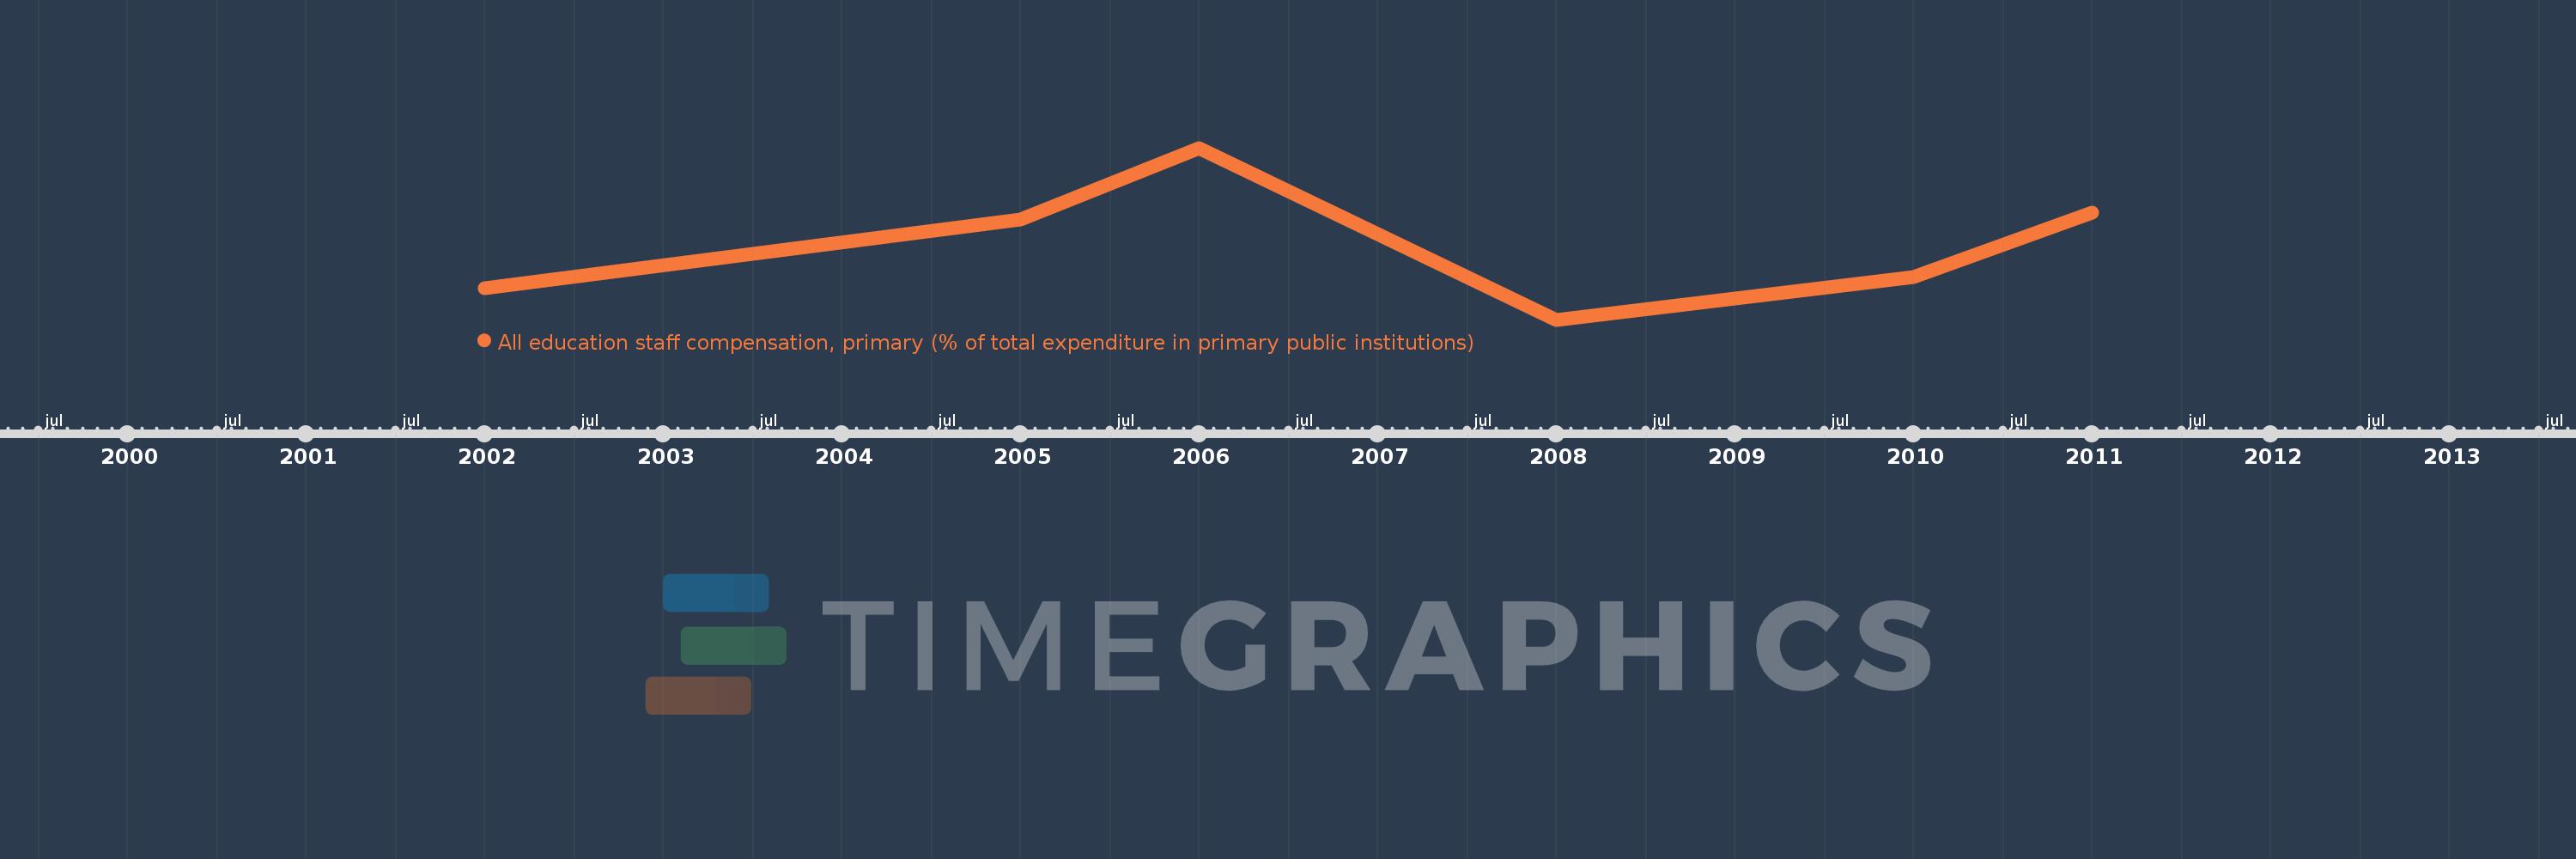
All education staff compensation, primary (% of total expenditure in primary public institutions)
2011,2010,2008,2006,2005,2002
This statistics in other country:
Timeline:
This timeline shows a graph from 2002 to 2011 of British Virgin Islands. No data until 2001. Number of actual observations by date: 6.
Source name:
World Development Indicators
Source organization:
United Nations Educational, Scientific, and Cultural Organization (UNESCO) Institute for Statistics.
Categories, topics:
Education
Last updated:
apr 23, 2017
Indicators value changes by year
Maximum:
99.381
jan 1, 2006
At the date of observation
Value
Absolute change
Change from previous value
jan 1, 2002
71.834
+71.834
0.0%
jan 1, 2005
85.407
+13.573
18.9%
jan 1, 2006
99.381
+13.975
16.36%
jan 1, 2008
65.65
-33.732
-33.94%
jan 1, 2010
73.996
+8.346
12.71%
jan 1, 2011
86.739
+12.743
17.22%
Ranking of countries by current statistics by years


Comments: