29
/
en
AIzaSyAYiBZKx7MnpbEhh9jyipgxe19OcubqV5w
April 1, 2024
35537
High income
HIC
false
2
1
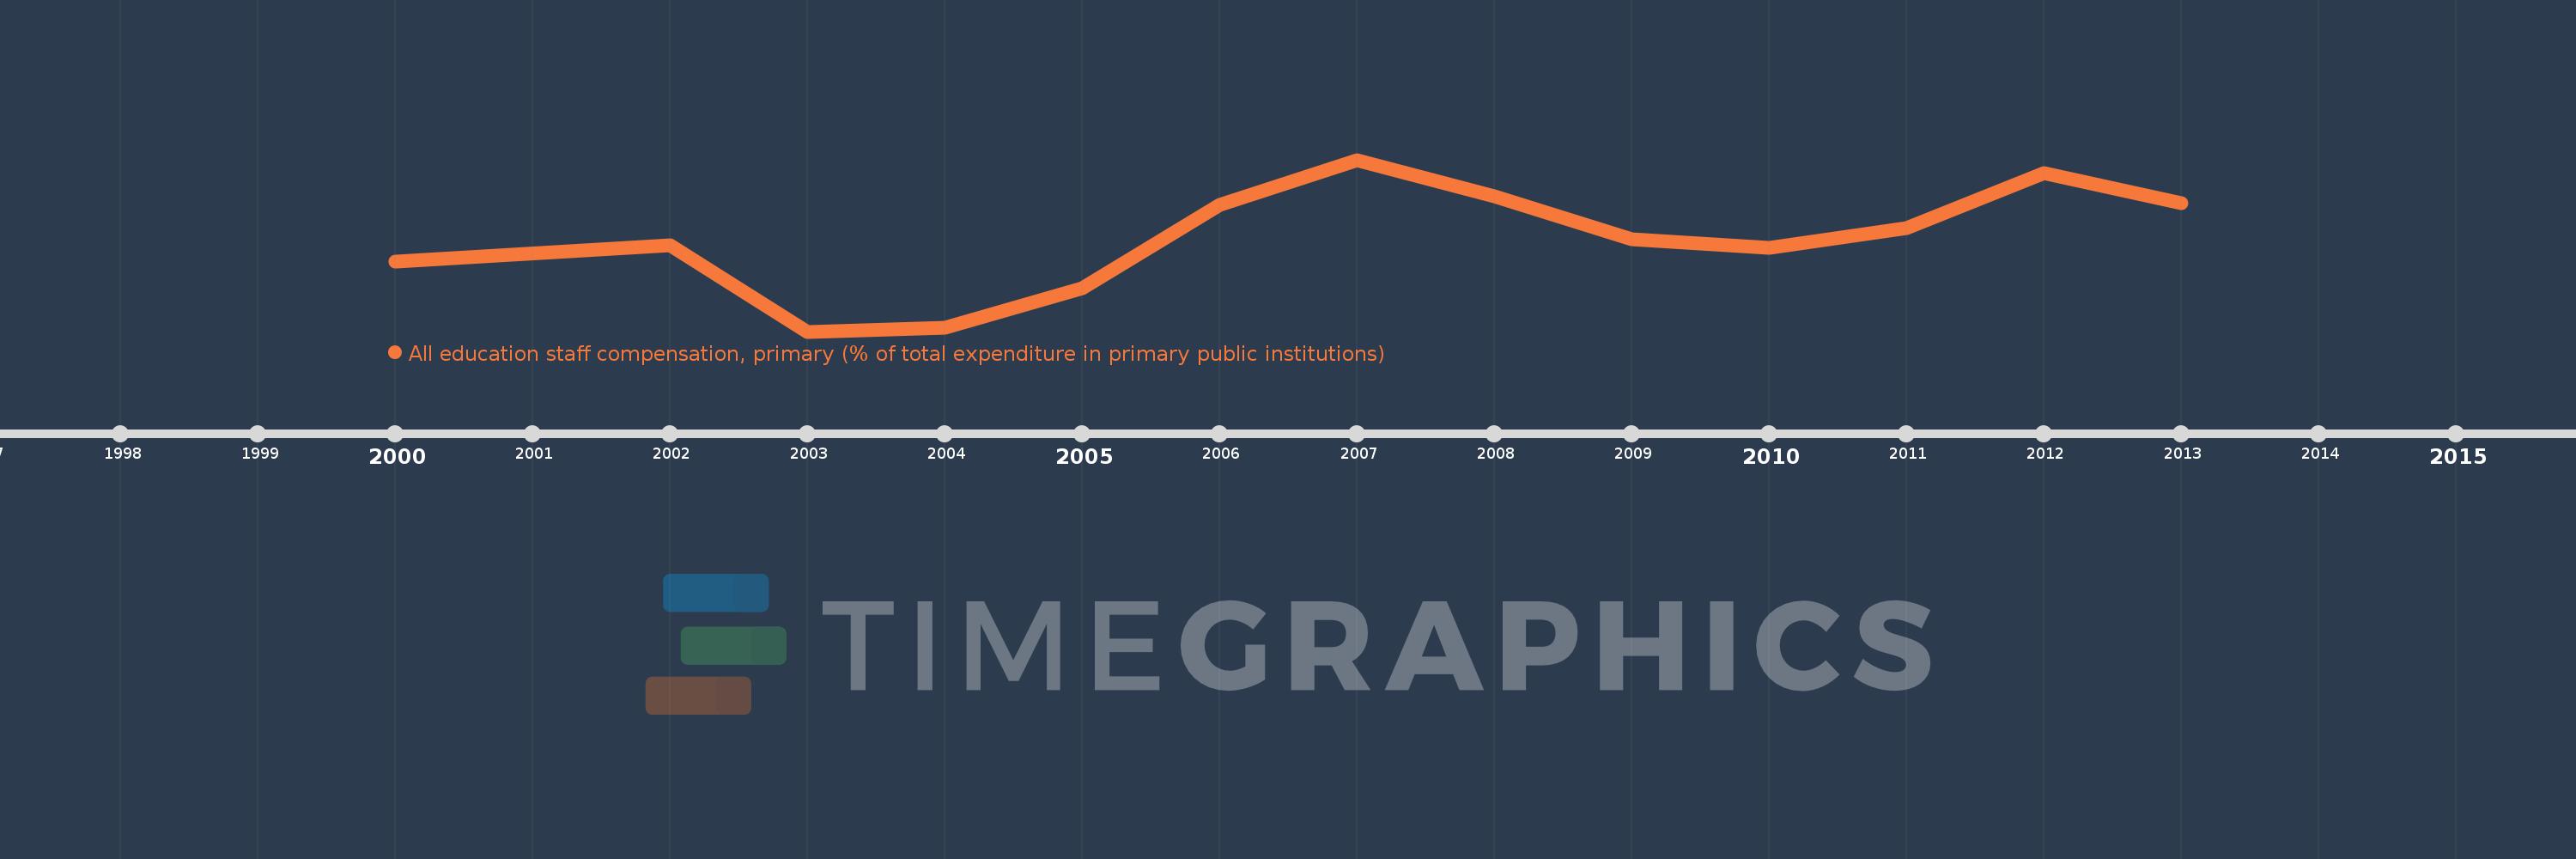
All education staff compensation, primary (% of total expenditure in primary public institutions)
2013,2012,2011,2010,2009,2008,2007,2006,2005,2004,2003,2002,2000
This statistics in other country:
Timeline:
This timeline shows a graph from 2000 to 2013 of High income. No data until 1999. Number of actual observations by date: 13.
Source name:
World Development Indicators
Source organization:
United Nations Educational, Scientific, and Cultural Organization (UNESCO) Institute for Statistics.
Categories, topics:
Education
Last updated:
apr 23, 2017
Indicators value changes by year
Minimum:
71.219
jan 1, 2003
At the date of observation
Value
Absolute change
Change from previous value
jan 1, 2000
72.829
+72.829
0.0%
jan 1, 2002
73.221
+0.391
0.54%
jan 1, 2003
71.219
-2.002
-2.73%
jan 1, 2004
71.31
+0.091
0.13%
jan 1, 2005
72.228
+0.918
1.29%
jan 1, 2006
74.144
+1.916
2.65%
jan 1, 2007
75.19
+1.045
1.41%
jan 1, 2008
74.354
-0.836
-1.11%
jan 1, 2009
73.345
-1.009
-1.36%
jan 1, 2010
73.163
-0.181
-0.25%
jan 1, 2011
73.616
+0.453
0.62%
jan 1, 2012
74.873
+1.257
1.71%
jan 1, 2013
74.195
-0.678
-0.91%
Ranking of countries by current statistics by years


Comments: