29
/
en
AIzaSyAYiBZKx7MnpbEhh9jyipgxe19OcubqV5w
April 1, 2024
207678
Netherlands
NLD
true
2
1
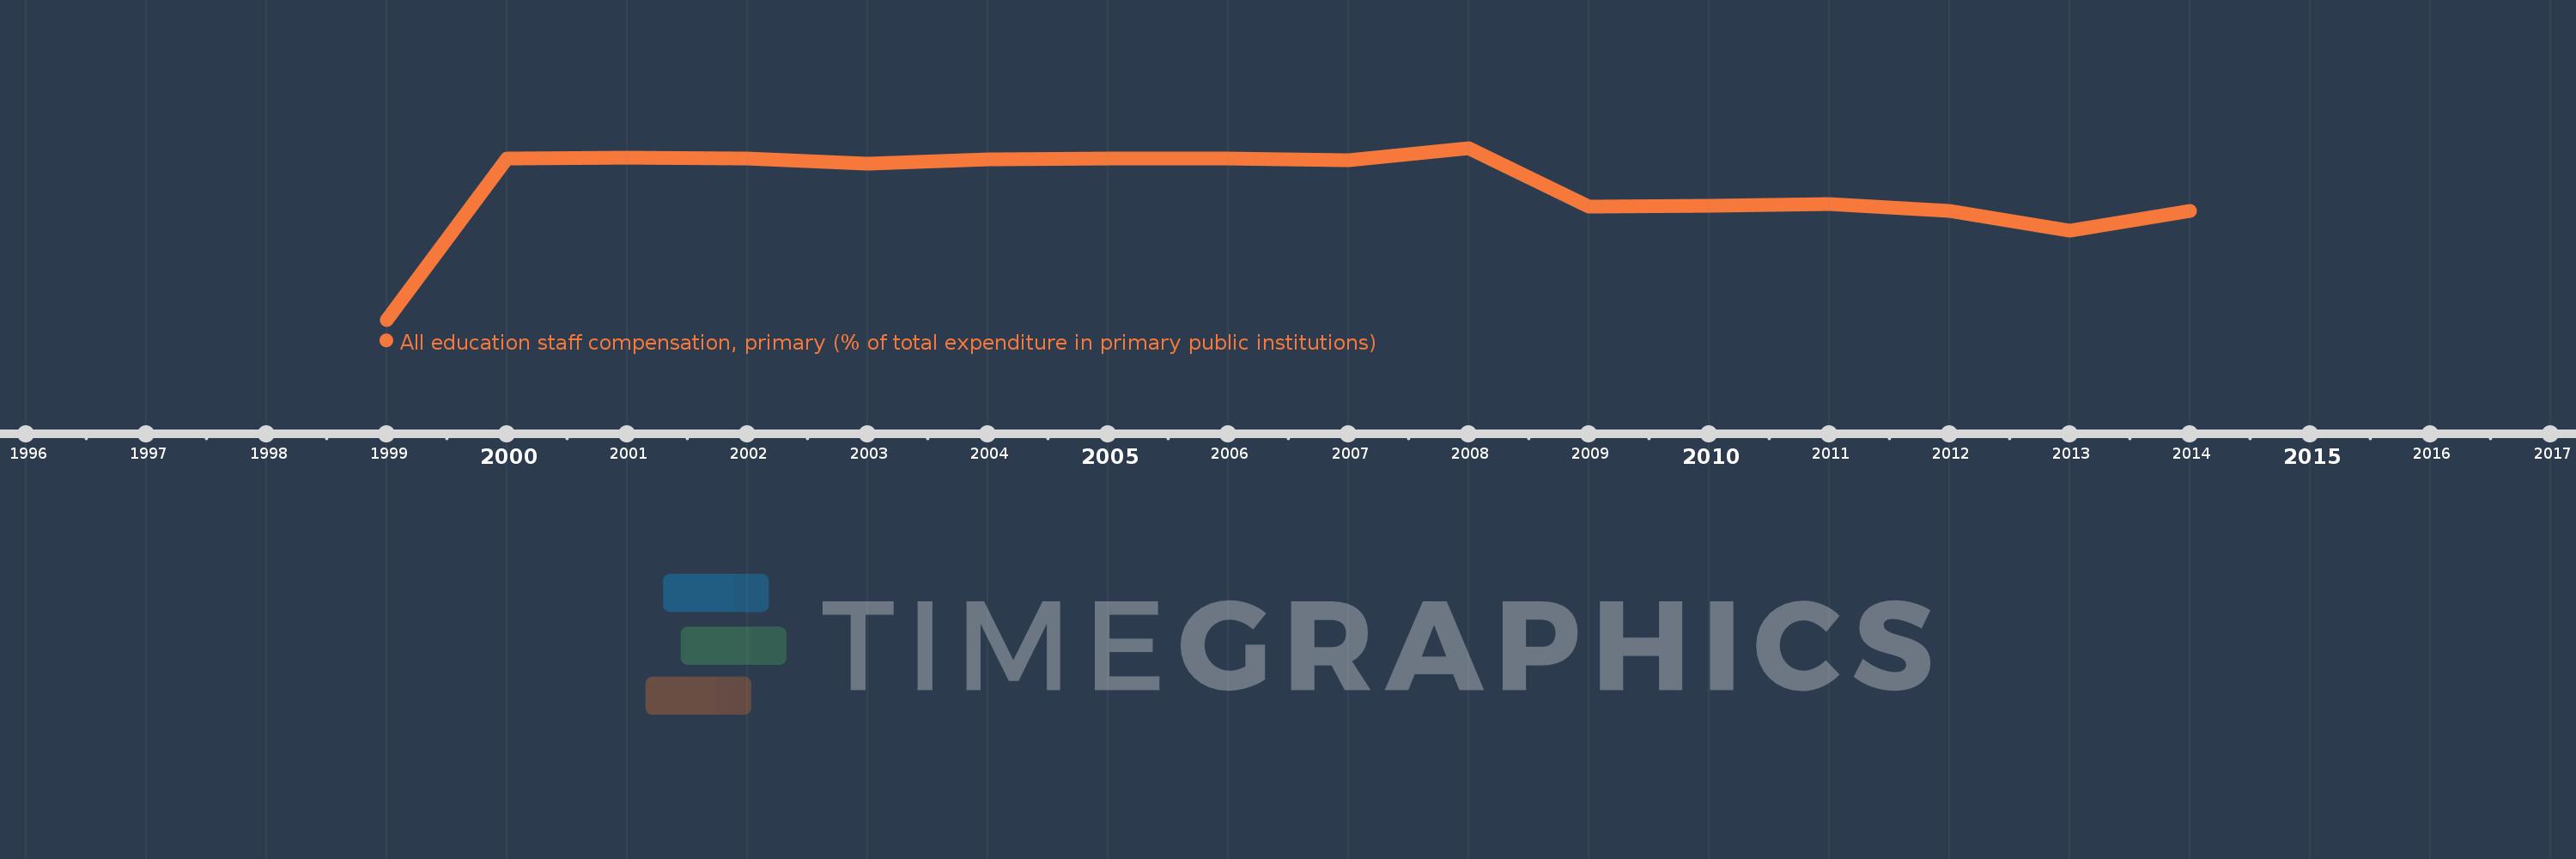
All education staff compensation, primary (% of total expenditure in primary public institutions)
2014,2013,2012,2011,2010,2009,2008,2007,2006,2005,2004,2003,2002,2001,2000,1999
This statistics in other country:
Timeline:
This timeline shows a graph from 1999 to 2014 of Netherlands. No data until 1998. Number of actual observations by date: 16.
Source name:
World Development Indicators
Source organization:
United Nations Educational, Scientific, and Cultural Organization (UNESCO) Institute for Statistics.
Categories, topics:
Education
Last updated:
apr 23, 2017
Indicators value changes by year
Minimum:
69.997
jan 1, 1999
Maximum:
75.582
jan 1, 2008
At the date of observation
Value
Absolute change
Change from previous value
jan 1, 1999
69.997
+69.997
0.0%
jan 1, 2000
75.248
+5.251
7.5%
jan 1, 2001
75.263
+0.015
0.02%
jan 1, 2002
75.246
-0.017
-0.02%
jan 1, 2003
75.061
-0.186
-0.25%
jan 1, 2004
75.222
+0.161
0.21%
jan 1, 2005
75.228
+0.006
0.01%
jan 1, 2006
75.229
+0.001
0.0%
jan 1, 2007
75.19
-0.039
-0.05%
jan 1, 2008
75.582
+0.392
0.52%
jan 1, 2009
73.685
-1.897
-2.51%
jan 1, 2010
73.693
+0.008
0.01%
jan 1, 2011
73.767
+0.074
0.1%
jan 1, 2012
73.537
-0.229
-0.31%
jan 1, 2013
72.893
-0.644
-0.88%
jan 1, 2014
73.525
+0.632
0.87%
Ranking of countries by current statistics by years


Comments: