29
/
en
AIzaSyAYiBZKx7MnpbEhh9jyipgxe19OcubqV5w
April 1, 2024
195172
Mexico
MEX
true
2
1
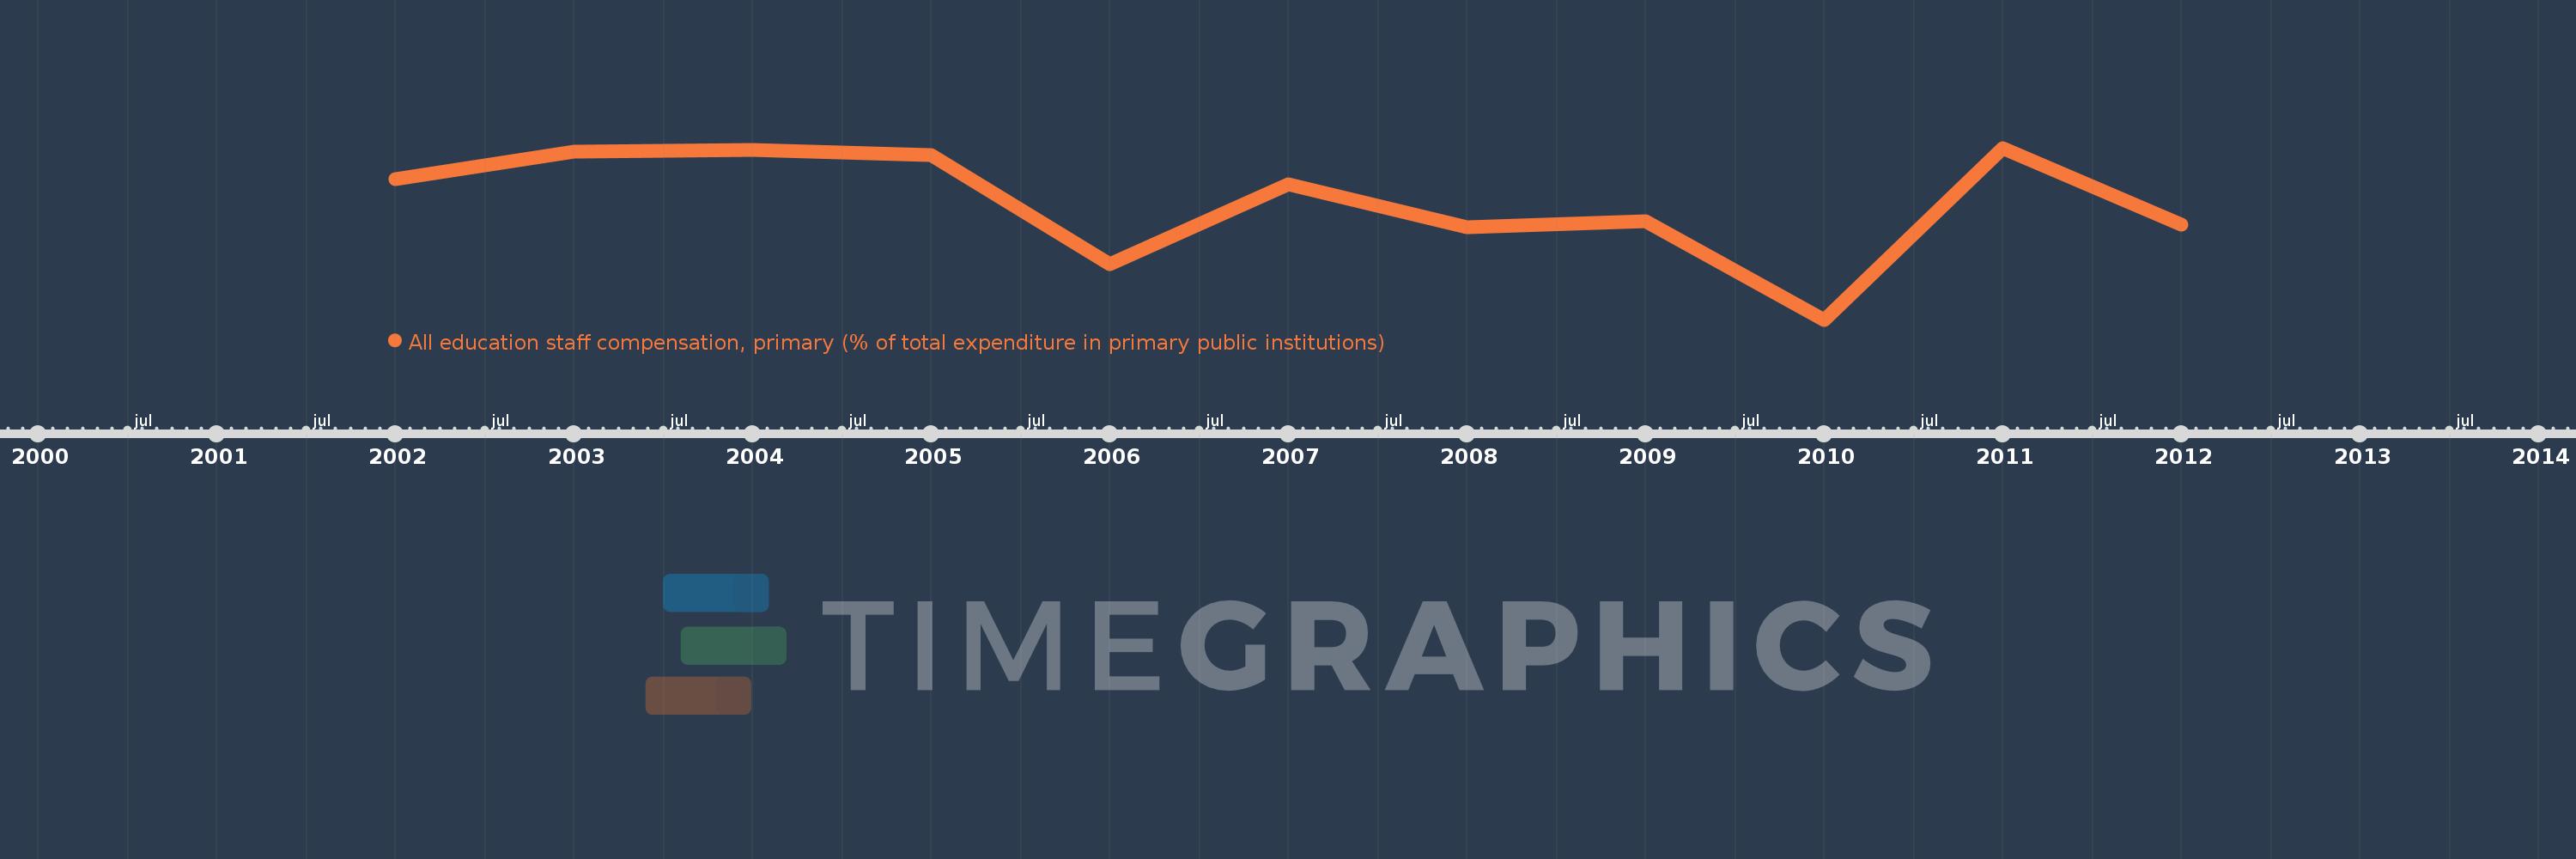
All education staff compensation, primary (% of total expenditure in primary public institutions)
2012,2011,2010,2009,2008,2007,2006,2005,2004,2003,2002
This statistics in other country:
Timeline:
This timeline shows a graph from 2002 to 2012 of Mexico. No data until 2001. Number of actual observations by date: 11.
Source name:
World Development Indicators
Source organization:
United Nations Educational, Scientific, and Cultural Organization (UNESCO) Institute for Statistics.
Categories, topics:
Education
Last updated:
apr 23, 2017
Indicators value changes by year
Minimum:
90.244
jan 1, 2010
Maximum:
93.731
jan 1, 2011
At the date of observation
Value
Absolute change
Change from previous value
jan 1, 2002
93.09
+93.09
0.0%
jan 1, 2003
93.662
+0.571
0.61%
jan 1, 2004
93.685
+0.023
0.02%
jan 1, 2005
93.595
-0.09
-0.1%
jan 1, 2006
91.37
-2.225
-2.38%
jan 1, 2007
92.985
+1.615
1.77%
jan 1, 2008
92.121
-0.865
-0.93%
jan 1, 2009
92.24
+0.12
0.13%
jan 1, 2010
90.244
-1.997
-2.16%
jan 1, 2011
93.731
+3.487
3.86%
jan 1, 2012
92.18
-1.551
-1.65%
Ranking of countries by current statistics by years


Comments: