29
/
en
AIzaSyAYiBZKx7MnpbEhh9jyipgxe19OcubqV5w
April 1, 2024
133846
France
FRA
true
2
1
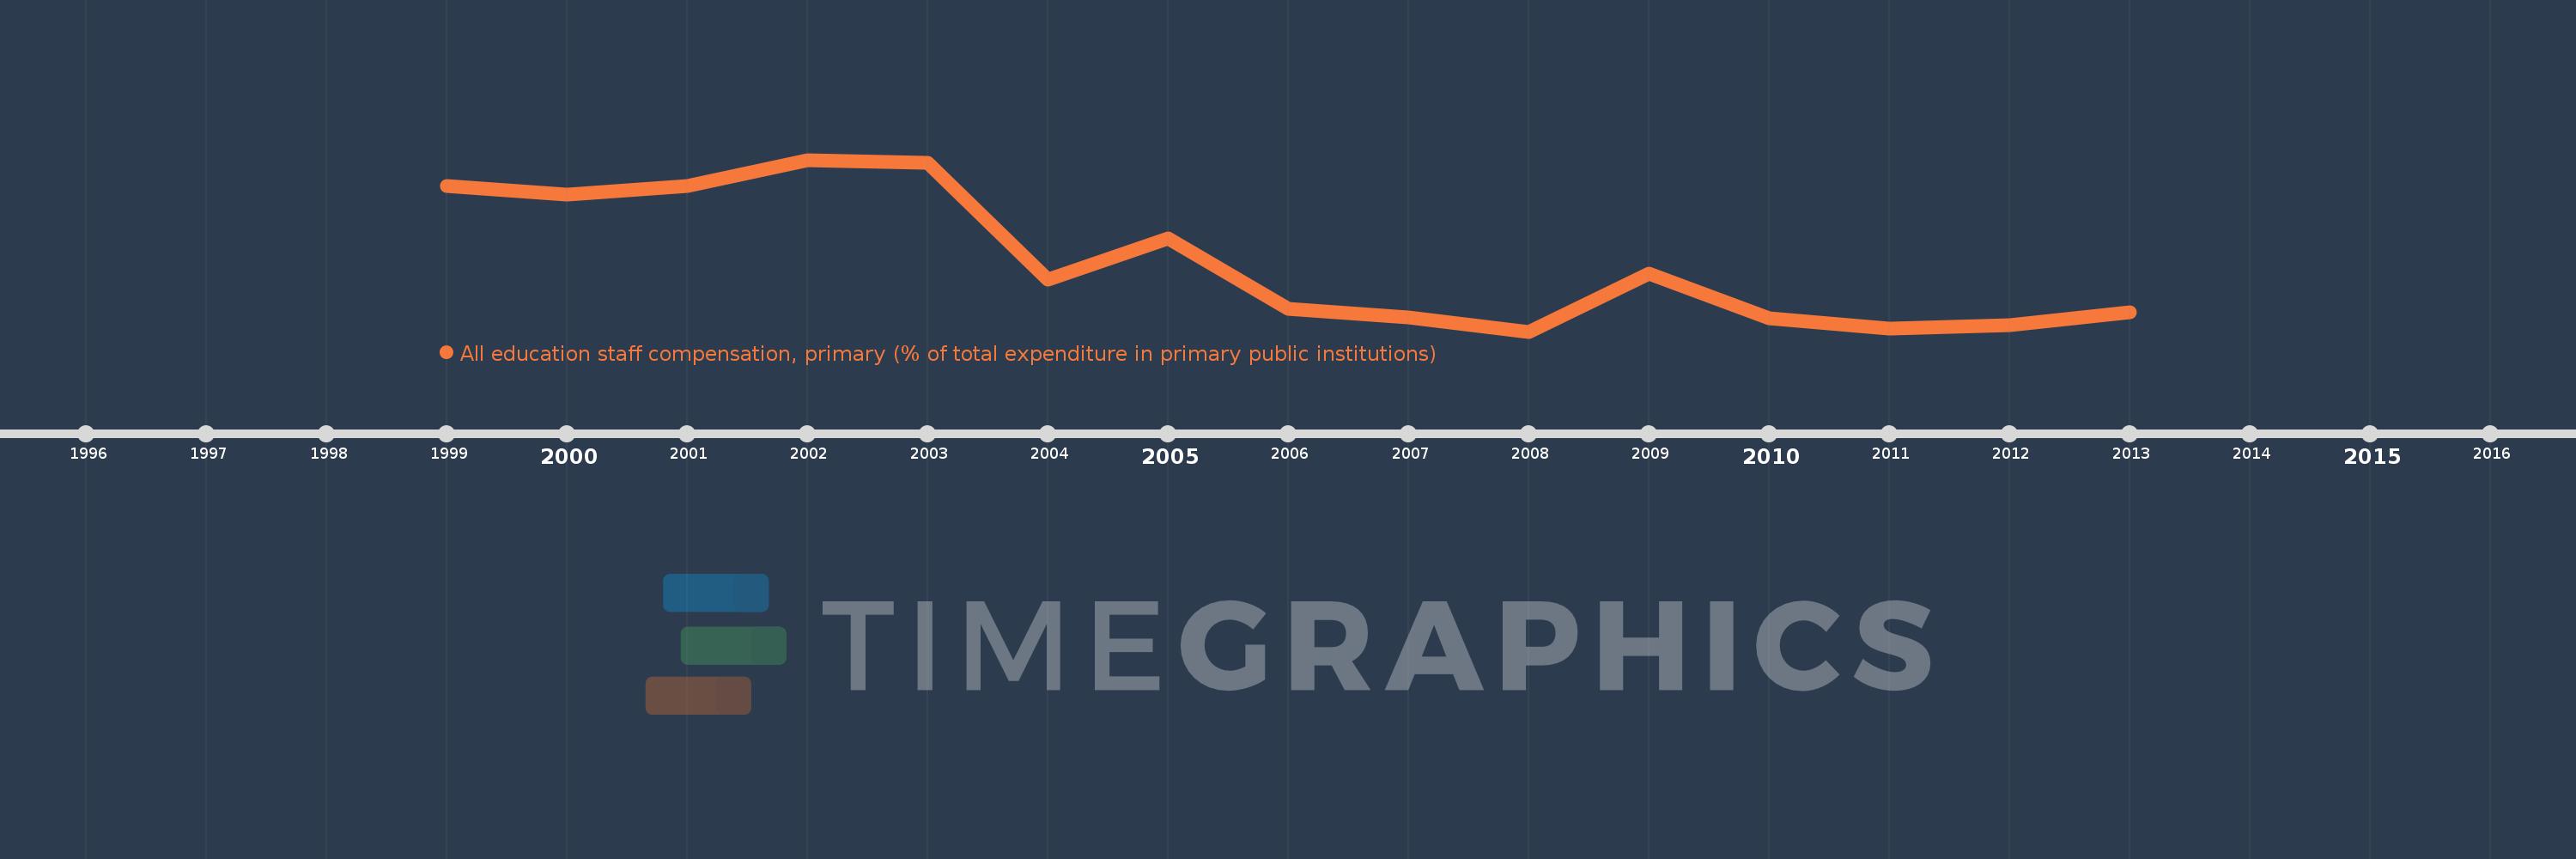
All education staff compensation, primary (% of total expenditure in primary public institutions)
2013,2012,2011,2010,2009,2008,2007,2006,2005,2004,2003,2002,2001,2000,1999
This statistics in other country:
Timeline:
This timeline shows a graph from 1999 to 2013 of France. No data until 1998. Number of actual observations by date: 15.
Source name:
World Development Indicators
Source organization:
United Nations Educational, Scientific, and Cultural Organization (UNESCO) Institute for Statistics.
Categories, topics:
Education
Last updated:
apr 23, 2017
Indicators value changes by year
Minimum:
70.728
jan 1, 2008
Maximum:
74.536
jan 1, 2002
At the date of observation
Value
Absolute change
Change from previous value
jan 1, 1999
73.963
+73.963
0.0%
jan 1, 2000
73.771
-0.192
-0.26%
jan 1, 2001
73.953
+0.182
0.25%
jan 1, 2002
74.536
+0.582
0.79%
jan 1, 2003
74.466
-0.069
-0.09%
jan 1, 2004
71.878
-2.589
-3.48%
jan 1, 2005
72.8
+0.923
1.28%
jan 1, 2006
71.232
-1.569
-2.15%
jan 1, 2007
71.039
-0.192
-0.27%
jan 1, 2008
70.728
-0.311
-0.44%
jan 1, 2009
72.009
+1.28
1.81%
jan 1, 2010
71.022
-0.987
-1.37%
jan 1, 2011
70.794
-0.228
-0.32%
jan 1, 2012
70.875
+0.081
0.12%
jan 1, 2013
71.155
+0.28
0.39%
Ranking of countries by current statistics by years


Comments: