29
/
en
AIzaSyAYiBZKx7MnpbEhh9jyipgxe19OcubqV5w
April 1, 2024
164470
Jordan
JOR
true
2
1
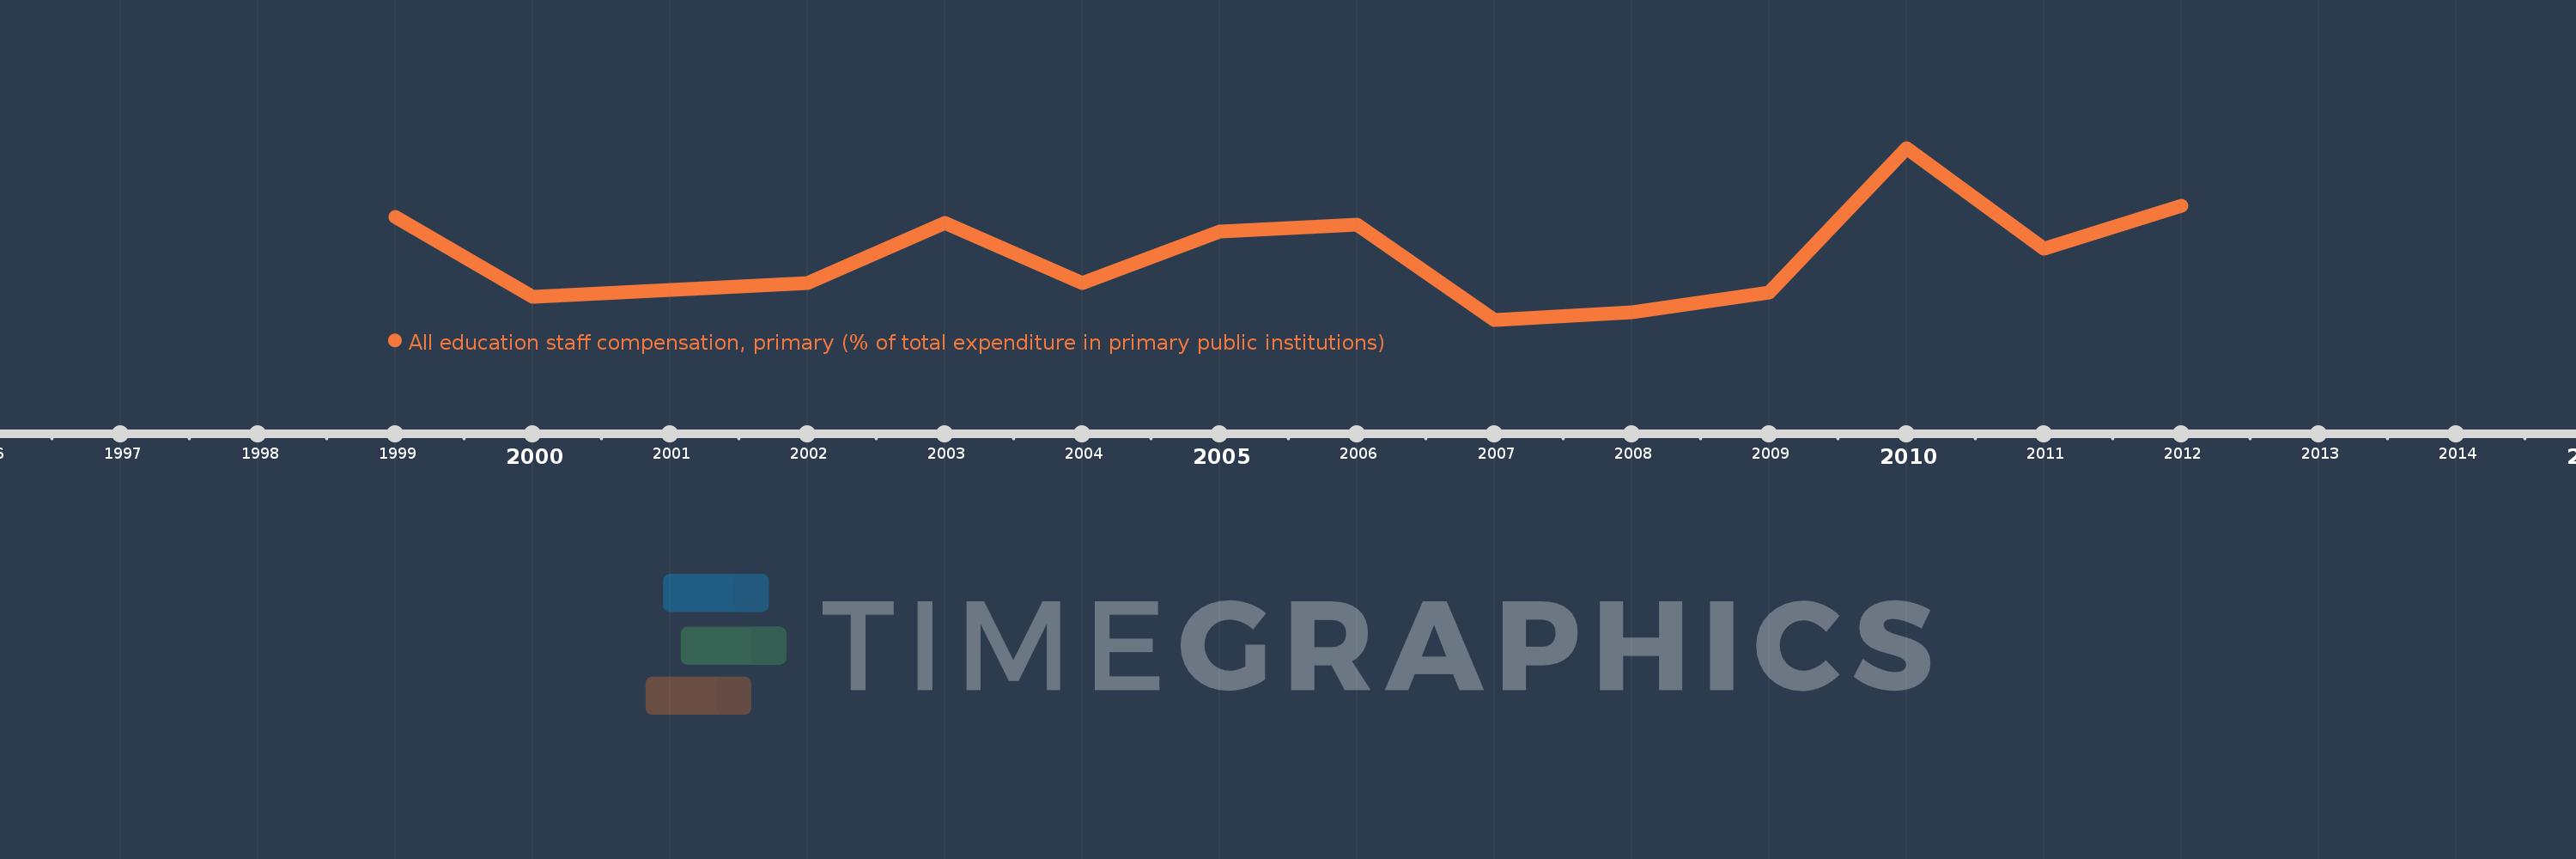
All education staff compensation, primary (% of total expenditure in primary public institutions)
2012,2011,2010,2009,2008,2007,2006,2005,2004,2003,2002,2000,1999
This statistics in other country:
Timeline:
This timeline shows a graph from 1999 to 2012 of Jordan. No data until 1998. Number of actual observations by date: 13.
Source name:
World Development Indicators
Source organization:
United Nations Educational, Scientific, and Cultural Organization (UNESCO) Institute for Statistics.
Categories, topics:
Education
Last updated:
apr 23, 2017
Indicators value changes by year
Minimum:
79.923
jan 1, 2007
Maximum:
99.964
jan 1, 2010
At the date of observation
Value
Absolute change
Change from previous value
jan 1, 1999
91.87
+91.87
0.0%
jan 1, 2000
82.552
-9.318
-10.14%
jan 1, 2002
84.238
+1.686
2.04%
jan 1, 2003
91.193
+6.955
8.26%
jan 1, 2004
84.236
-6.957
-7.63%
jan 1, 2005
90.246
+6.01
7.13%
jan 1, 2006
91.013
+0.766
0.85%
jan 1, 2007
79.923
-11.09
-12.19%
jan 1, 2008
80.829
+0.906
1.13%
jan 1, 2009
83.075
+2.246
2.78%
jan 1, 2010
99.964
+16.889
20.33%
jan 1, 2011
88.21
-11.754
-11.76%
jan 1, 2012
93.244
+5.034
5.71%
Ranking of countries by current statistics by years


Comments: