29
/
en
AIzaSyAYiBZKx7MnpbEhh9jyipgxe19OcubqV5w
April 1, 2024
73654
Austria
AUT
true
2
1
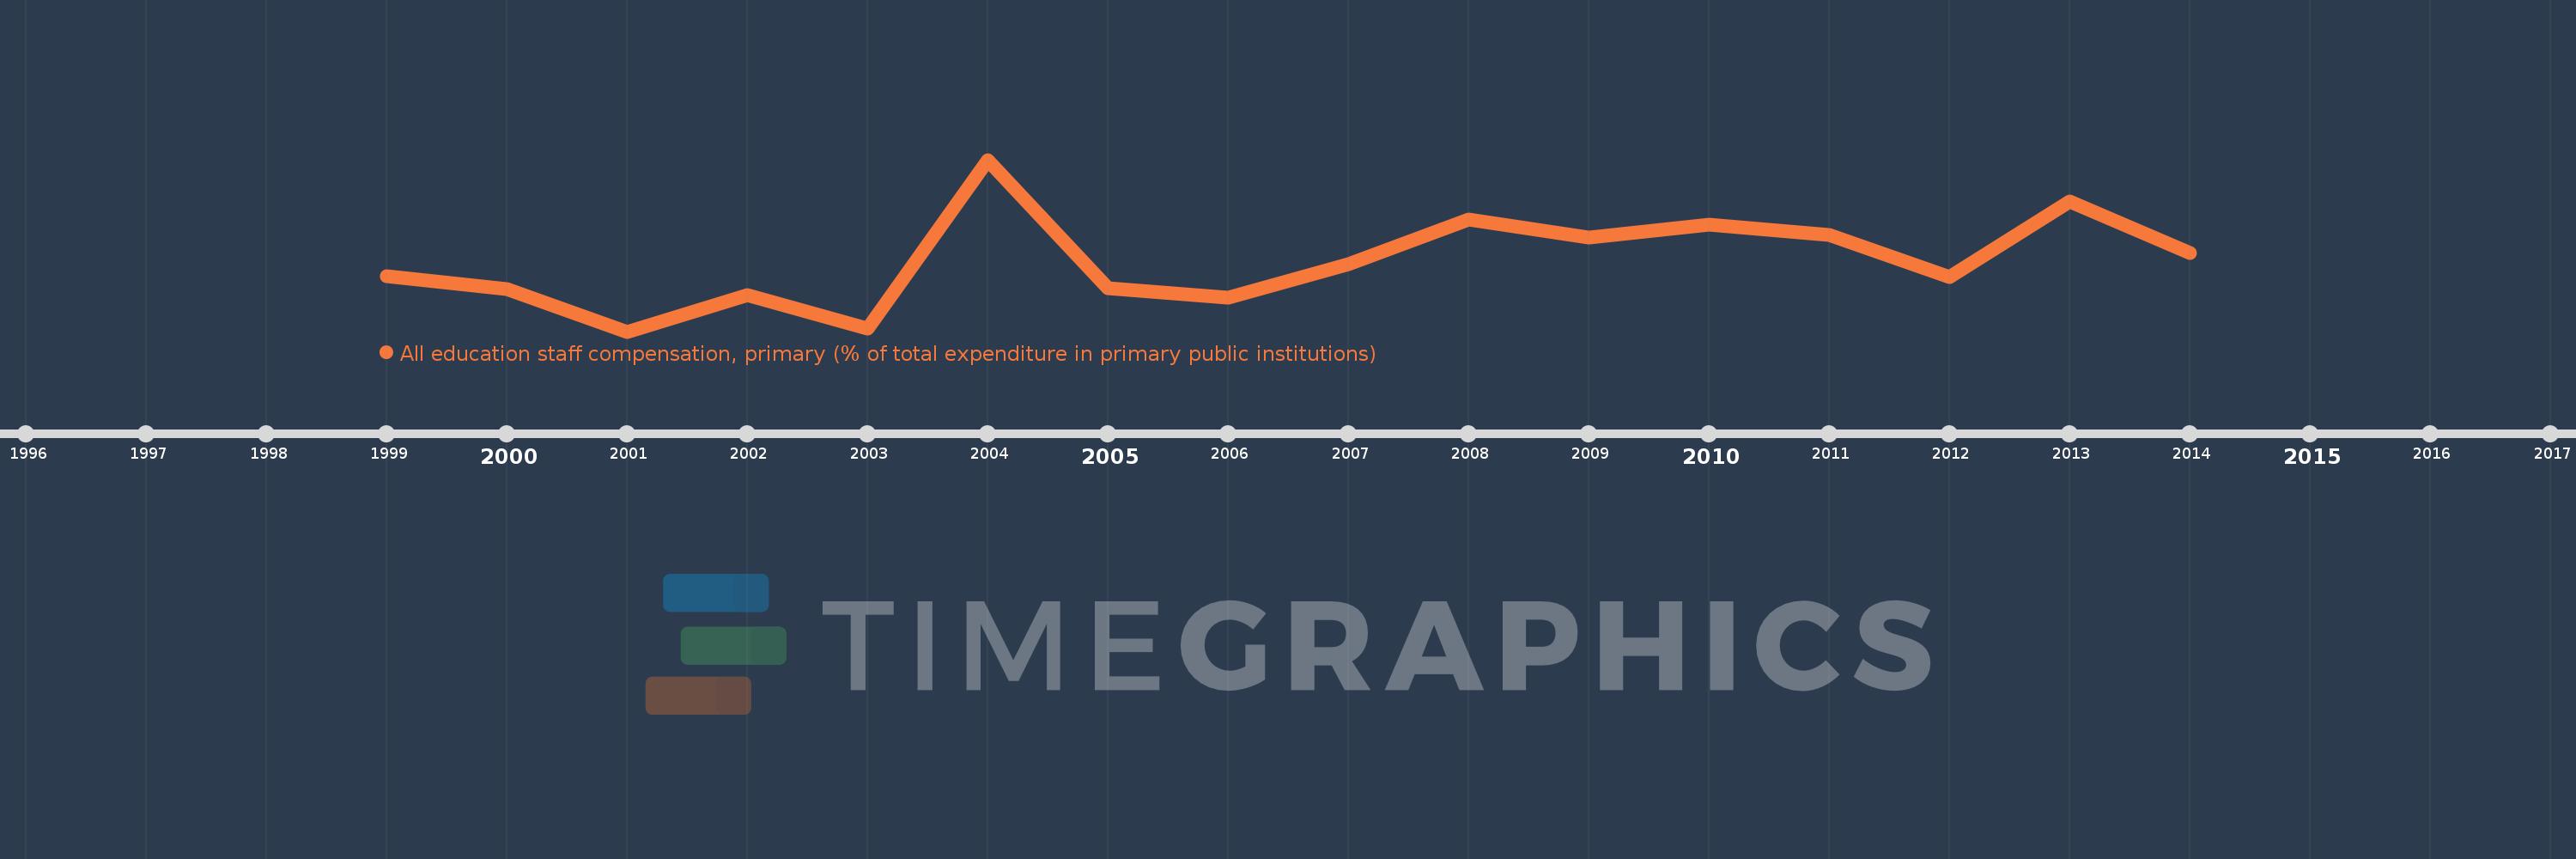
All education staff compensation, primary (% of total expenditure in primary public institutions)
2014,2013,2012,2011,2010,2009,2008,2007,2006,2005,2004,2003,2002,2001,2000,1999
This statistics in other country:
Timeline:
This timeline shows a graph from 1999 to 2014 of Austria. No data until 1998. Number of actual observations by date: 16.
Source name:
World Development Indicators
Source organization:
United Nations Educational, Scientific, and Cultural Organization (UNESCO) Institute for Statistics.
Categories, topics:
Education
Last updated:
apr 23, 2017
Indicators value changes by year
Minimum:
70.702
jan 1, 2001
Maximum:
75.314
jan 1, 2004
At the date of observation
Value
Absolute change
Change from previous value
jan 1, 1999
72.187
+72.187
0.0%
jan 1, 2000
71.844
-0.343
-0.48%
jan 1, 2001
70.702
-1.142
-1.59%
jan 1, 2002
71.675
+0.973
1.38%
jan 1, 2003
70.792
-0.883
-1.23%
jan 1, 2004
75.314
+4.522
6.39%
jan 1, 2005
71.878
-3.436
-4.56%
jan 1, 2006
71.617
-0.262
-0.36%
jan 1, 2007
72.523
+0.907
1.27%
jan 1, 2008
73.708
+1.184
1.63%
jan 1, 2009
73.22
-0.488
-0.66%
jan 1, 2010
73.582
+0.362
0.49%
jan 1, 2011
73.3
-0.283
-0.38%
jan 1, 2012
72.172
-1.128
-1.54%
jan 1, 2013
74.195
+2.023
2.8%
jan 1, 2014
72.806
-1.389
-1.87%
Ranking of countries by current statistics by years


Comments: