29
/
en
AIzaSyAYiBZKx7MnpbEhh9jyipgxe19OcubqV5w
April 1, 2024
52408
OECD members
OED
false
2
1
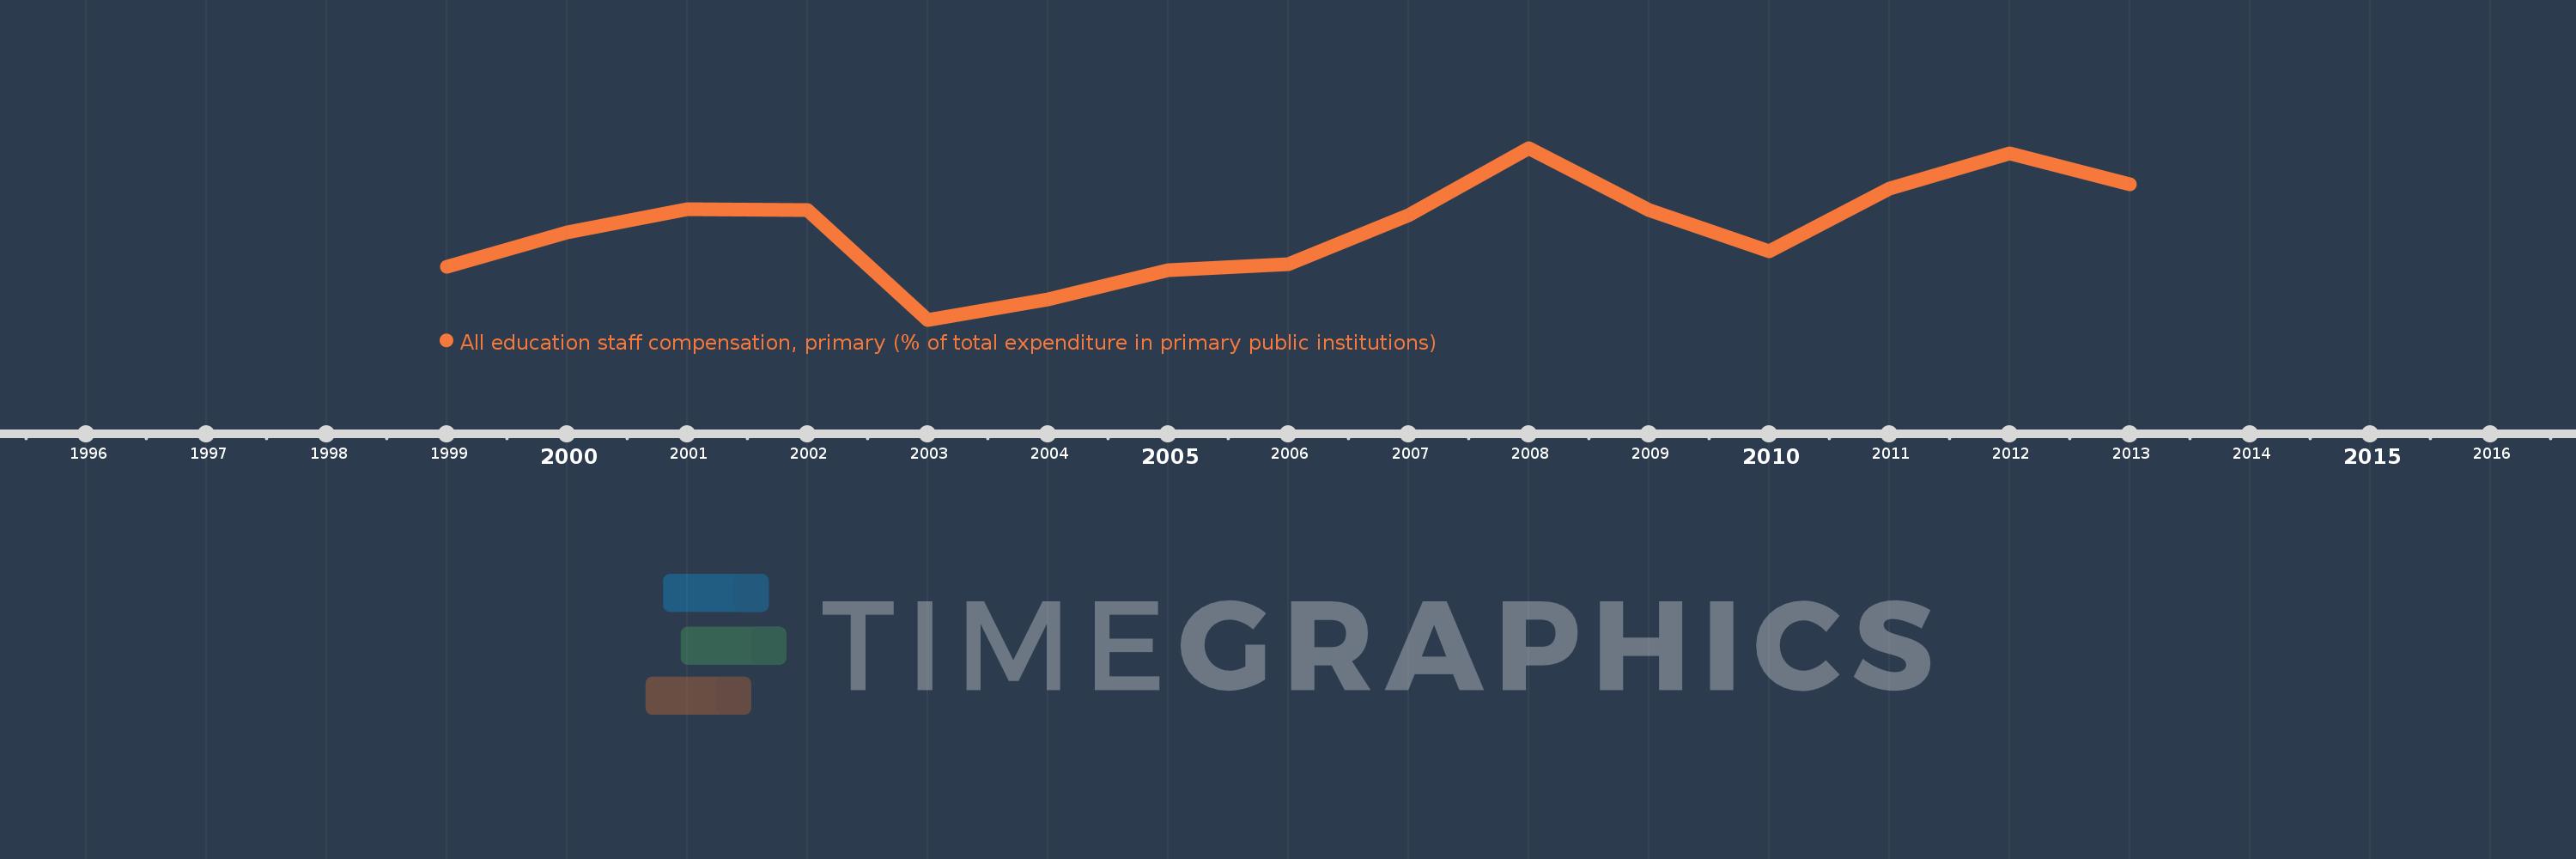
All education staff compensation, primary (% of total expenditure in primary public institutions)
2013,2012,2011,2010,2009,2008,2007,2006,2005,2004,2003,2002,2001,2000,1999
This statistics in other country:
Timeline:
This timeline shows a graph from 1999 to 2013 of OECD members. No data until 1998. Number of actual observations by date: 15.
Source name:
World Development Indicators
Source organization:
United Nations Educational, Scientific, and Cultural Organization (UNESCO) Institute for Statistics.
Categories, topics:
Education
Last updated:
apr 23, 2017
Indicators value changes by year
Minimum:
71.219
jan 1, 2003
Maximum:
74.354
jan 1, 2008
At the date of observation
Value
Absolute change
Change from previous value
jan 1, 1999
72.187
+72.187
0.0%
jan 1, 2000
72.816
+0.629
0.87%
jan 1, 2001
73.24
+0.424
0.58%
jan 1, 2002
73.221
-0.019
-0.03%
jan 1, 2003
71.219
-2.002
-2.73%
jan 1, 2004
71.594
+0.375
0.53%
jan 1, 2005
72.117
+0.524
0.73%
jan 1, 2006
72.238
+0.121
0.17%
jan 1, 2007
73.123
+0.884
1.22%
jan 1, 2008
74.354
+1.231
1.68%
jan 1, 2009
73.22
-1.134
-1.52%
jan 1, 2010
72.466
-0.754
-1.03%
jan 1, 2011
73.616
+1.15
1.59%
jan 1, 2012
74.256
+0.64
0.87%
jan 1, 2013
73.69
-0.566
-0.76%
Ranking of countries by current statistics by years


Comments: