29
/
en
AIzaSyAYiBZKx7MnpbEhh9jyipgxe19OcubqV5w
April 1, 2024
132890
Finland
FIN
true
2
1
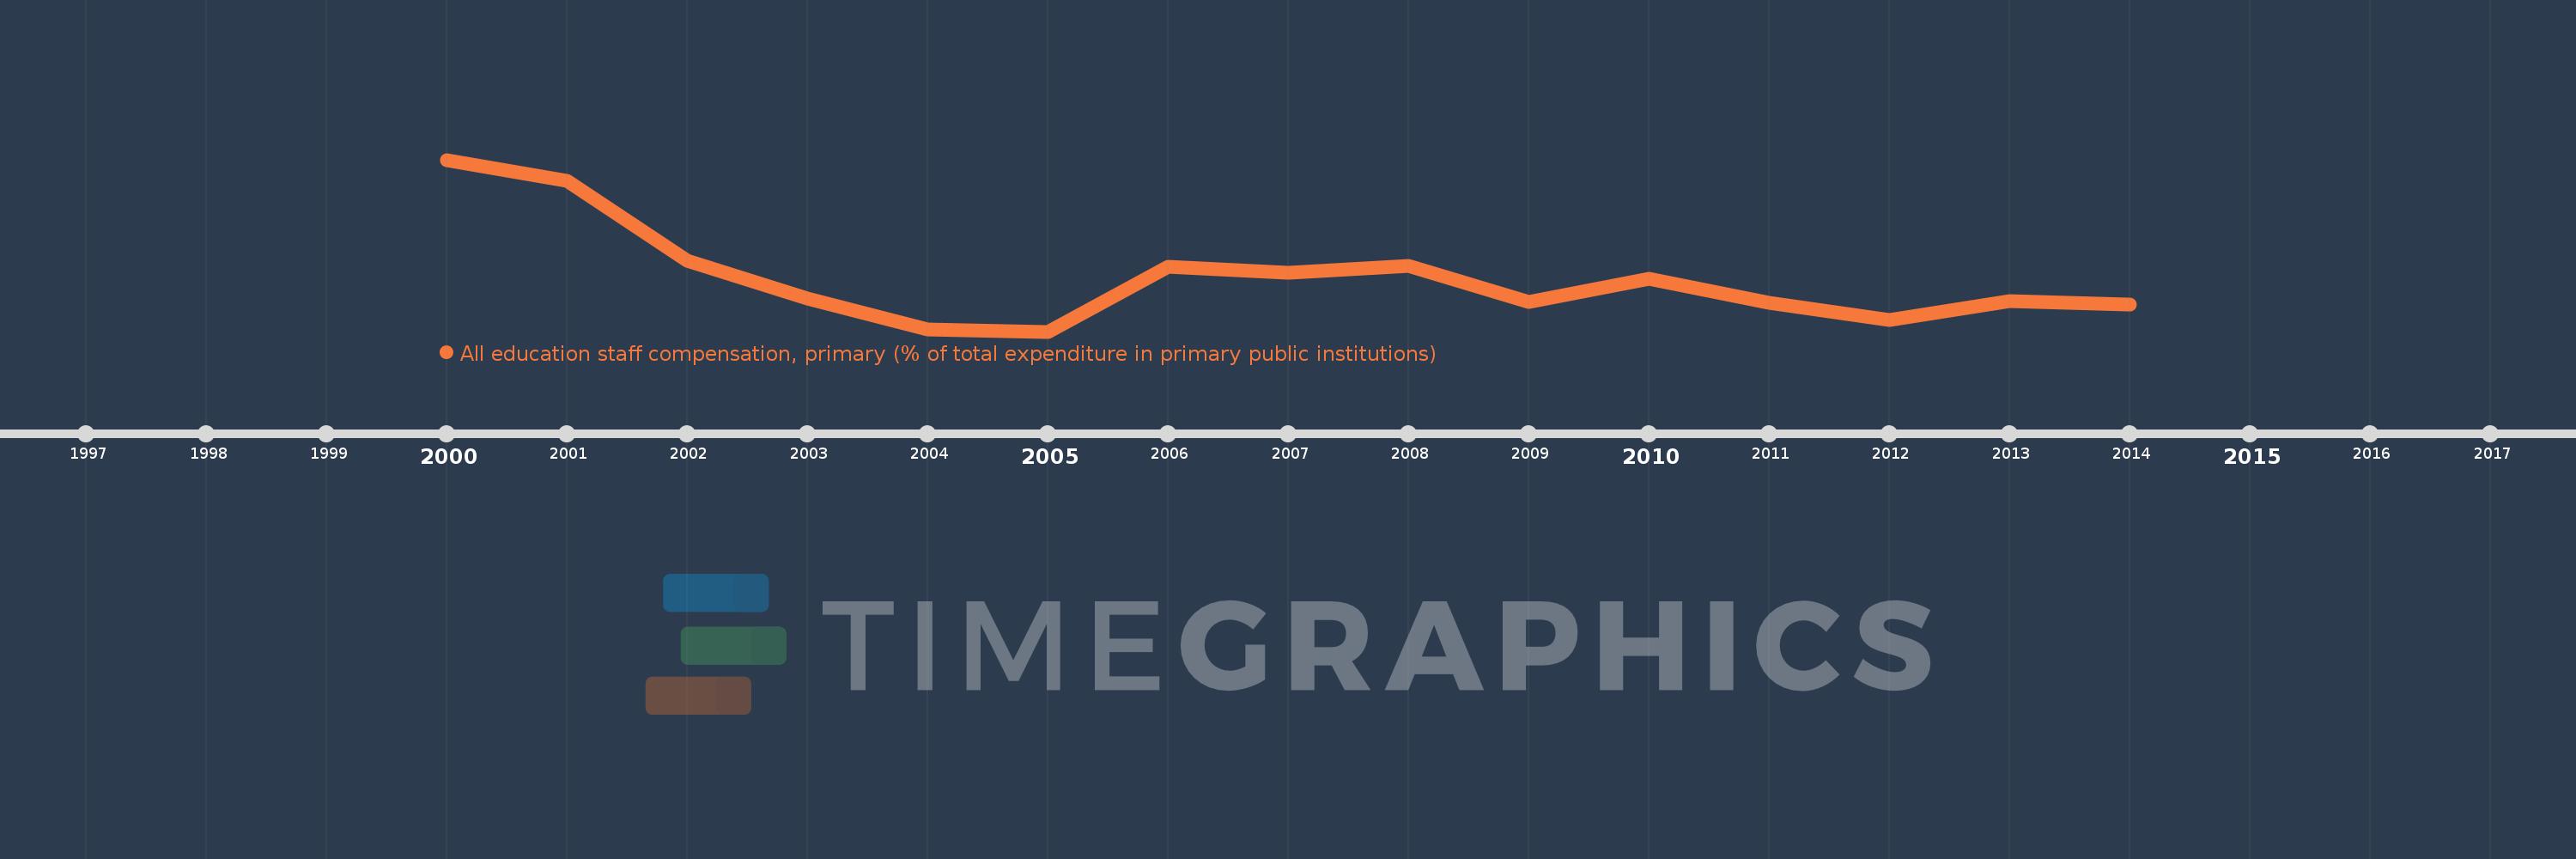
All education staff compensation, primary (% of total expenditure in primary public institutions)
2014,2013,2012,2011,2010,2009,2008,2007,2006,2005,2004,2003,2002,2001,2000
This statistics in other country:
Timeline:
This timeline shows a graph from 2000 to 2014 of Finland. No data until 1999. Number of actual observations by date: 15.
Source name:
World Development Indicators
Source organization:
United Nations Educational, Scientific, and Cultural Organization (UNESCO) Institute for Statistics.
Categories, topics:
Education
Last updated:
apr 23, 2017
Indicators value changes by year
Maximum:
65.069
jan 1, 2000
At the date of observation
Value
Absolute change
Change from previous value
jan 1, 2000
65.069
+65.069
0.0%
jan 1, 2001
64.361
-0.708
-1.09%
jan 1, 2002
61.631
-2.73
-4.24%
jan 1, 2003
60.337
-1.293
-2.1%
jan 1, 2004
59.297
-1.04
-1.72%
jan 1, 2005
59.22
-0.077
-0.13%
jan 1, 2006
61.419
+2.199
3.71%
jan 1, 2007
61.218
-0.201
-0.33%
jan 1, 2008
61.453
+0.235
0.38%
jan 1, 2009
60.243
-1.21
-1.97%
jan 1, 2010
61.007
+0.763
1.27%
jan 1, 2011
60.198
-0.809
-1.33%
jan 1, 2012
59.624
-0.574
-0.95%
jan 1, 2013
60.25
+0.626
1.05%
jan 1, 2014
60.144
-0.106
-0.18%
Ranking of countries by current statistics by years


Comments: