29
/
en
AIzaSyAYiBZKx7MnpbEhh9jyipgxe19OcubqV5w
April 1, 2024
180812
Lithuania
LTU
true
2
1
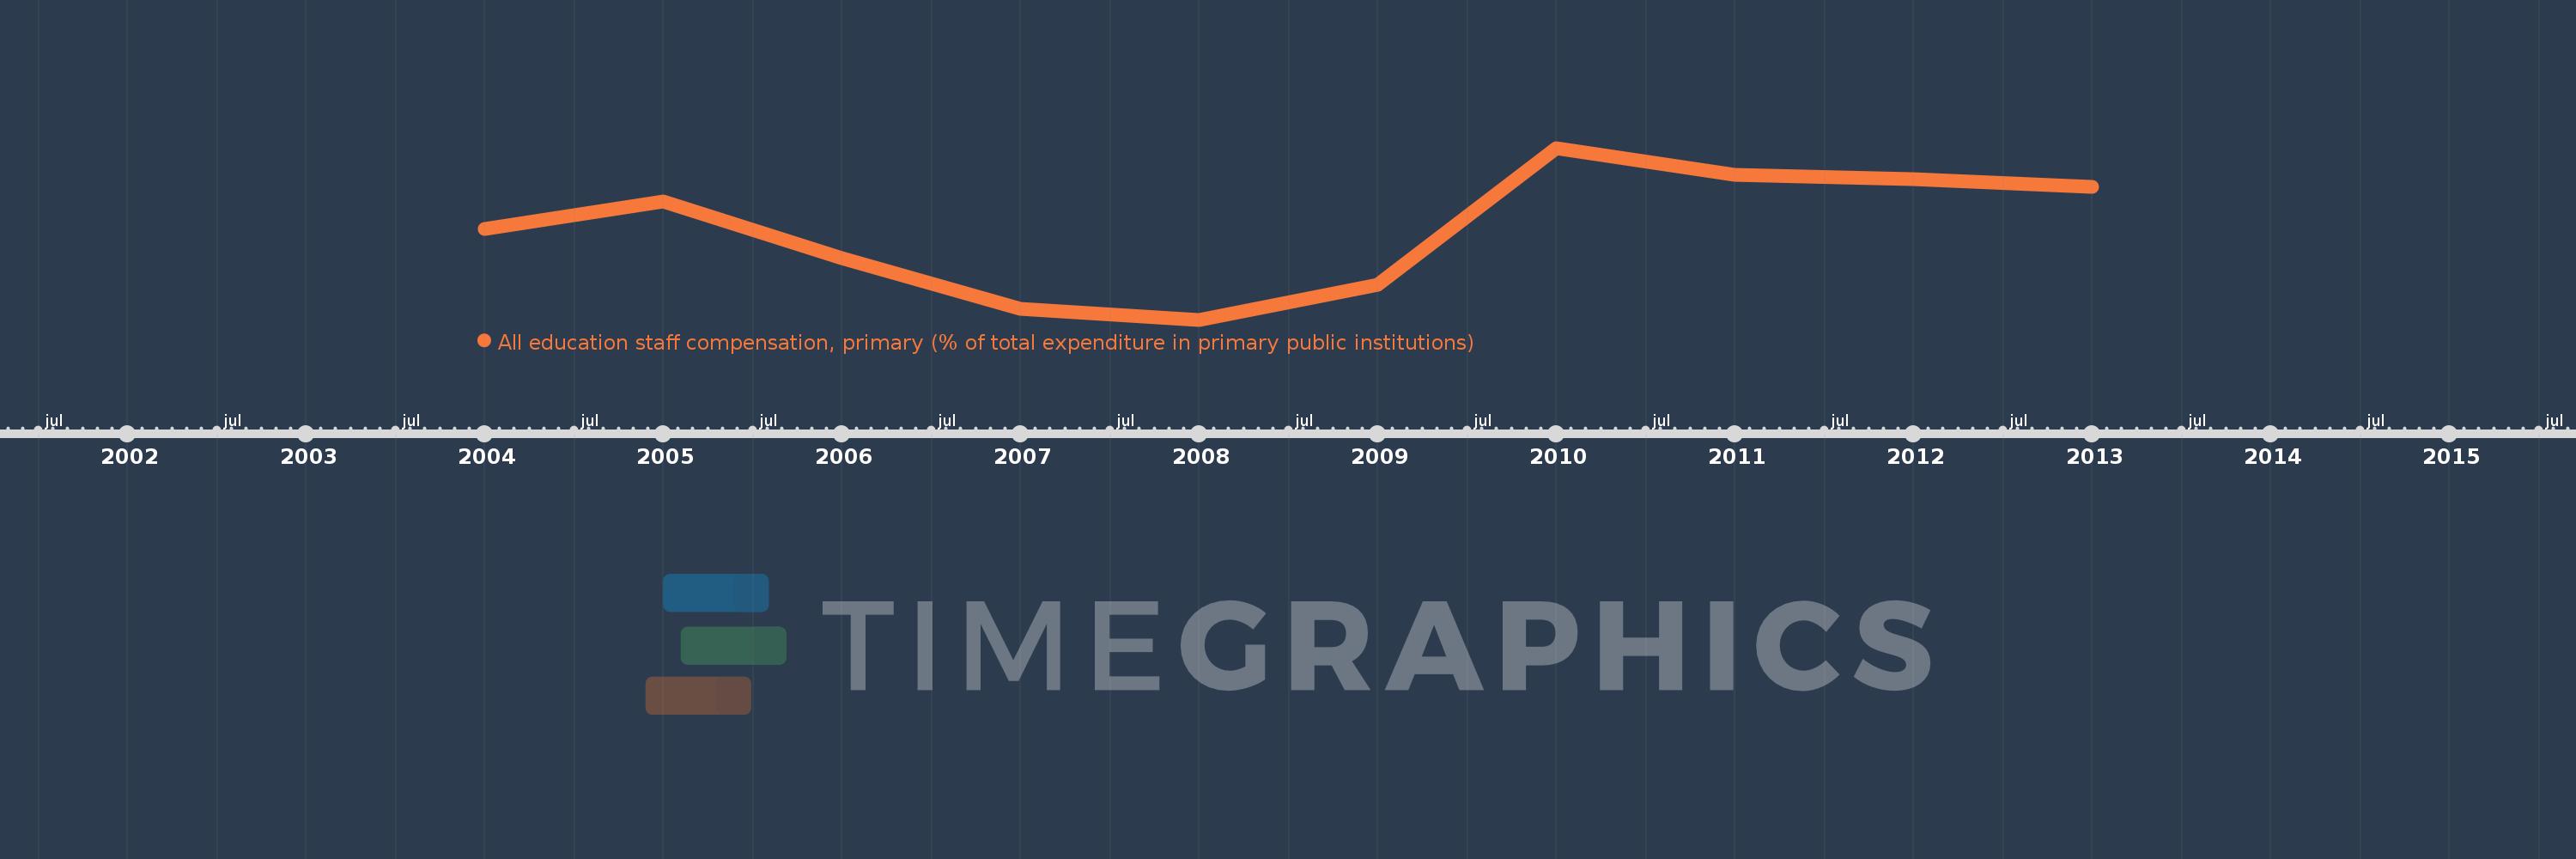
All education staff compensation, primary (% of total expenditure in primary public institutions)
2013,2012,2011,2010,2009,2008,2007,2006,2005,2004
This statistics in other country:
Timeline:
This timeline shows a graph from 2004 to 2013 of Lithuania. No data until 2003. Number of actual observations by date: 10.
Source name:
World Development Indicators
Source organization:
United Nations Educational, Scientific, and Cultural Organization (UNESCO) Institute for Statistics.
Categories, topics:
Education
Last updated:
apr 23, 2017
Indicators value changes by year
Minimum:
68.938
jan 1, 2008
Maximum:
83.288
jan 1, 2010
At the date of observation
Value
Absolute change
Change from previous value
jan 1, 2004
76.547
+76.547
0.0%
jan 1, 2005
78.791
+2.244
2.93%
jan 1, 2006
74.089
-4.702
-5.97%
jan 1, 2007
69.862
-4.227
-5.71%
jan 1, 2008
68.938
-0.924
-1.32%
jan 1, 2009
71.888
+2.95
4.28%
jan 1, 2010
83.288
+11.4
15.86%
jan 1, 2011
81.077
-2.211
-2.65%
jan 1, 2012
80.655
-0.422
-0.52%
jan 1, 2013
80.066
-0.589
-0.73%
Ranking of countries by current statistics by years


Comments: