29
/
en
AIzaSyAYiBZKx7MnpbEhh9jyipgxe19OcubqV5w
April 1, 2024
83722
Benin
BEN
true
2
1
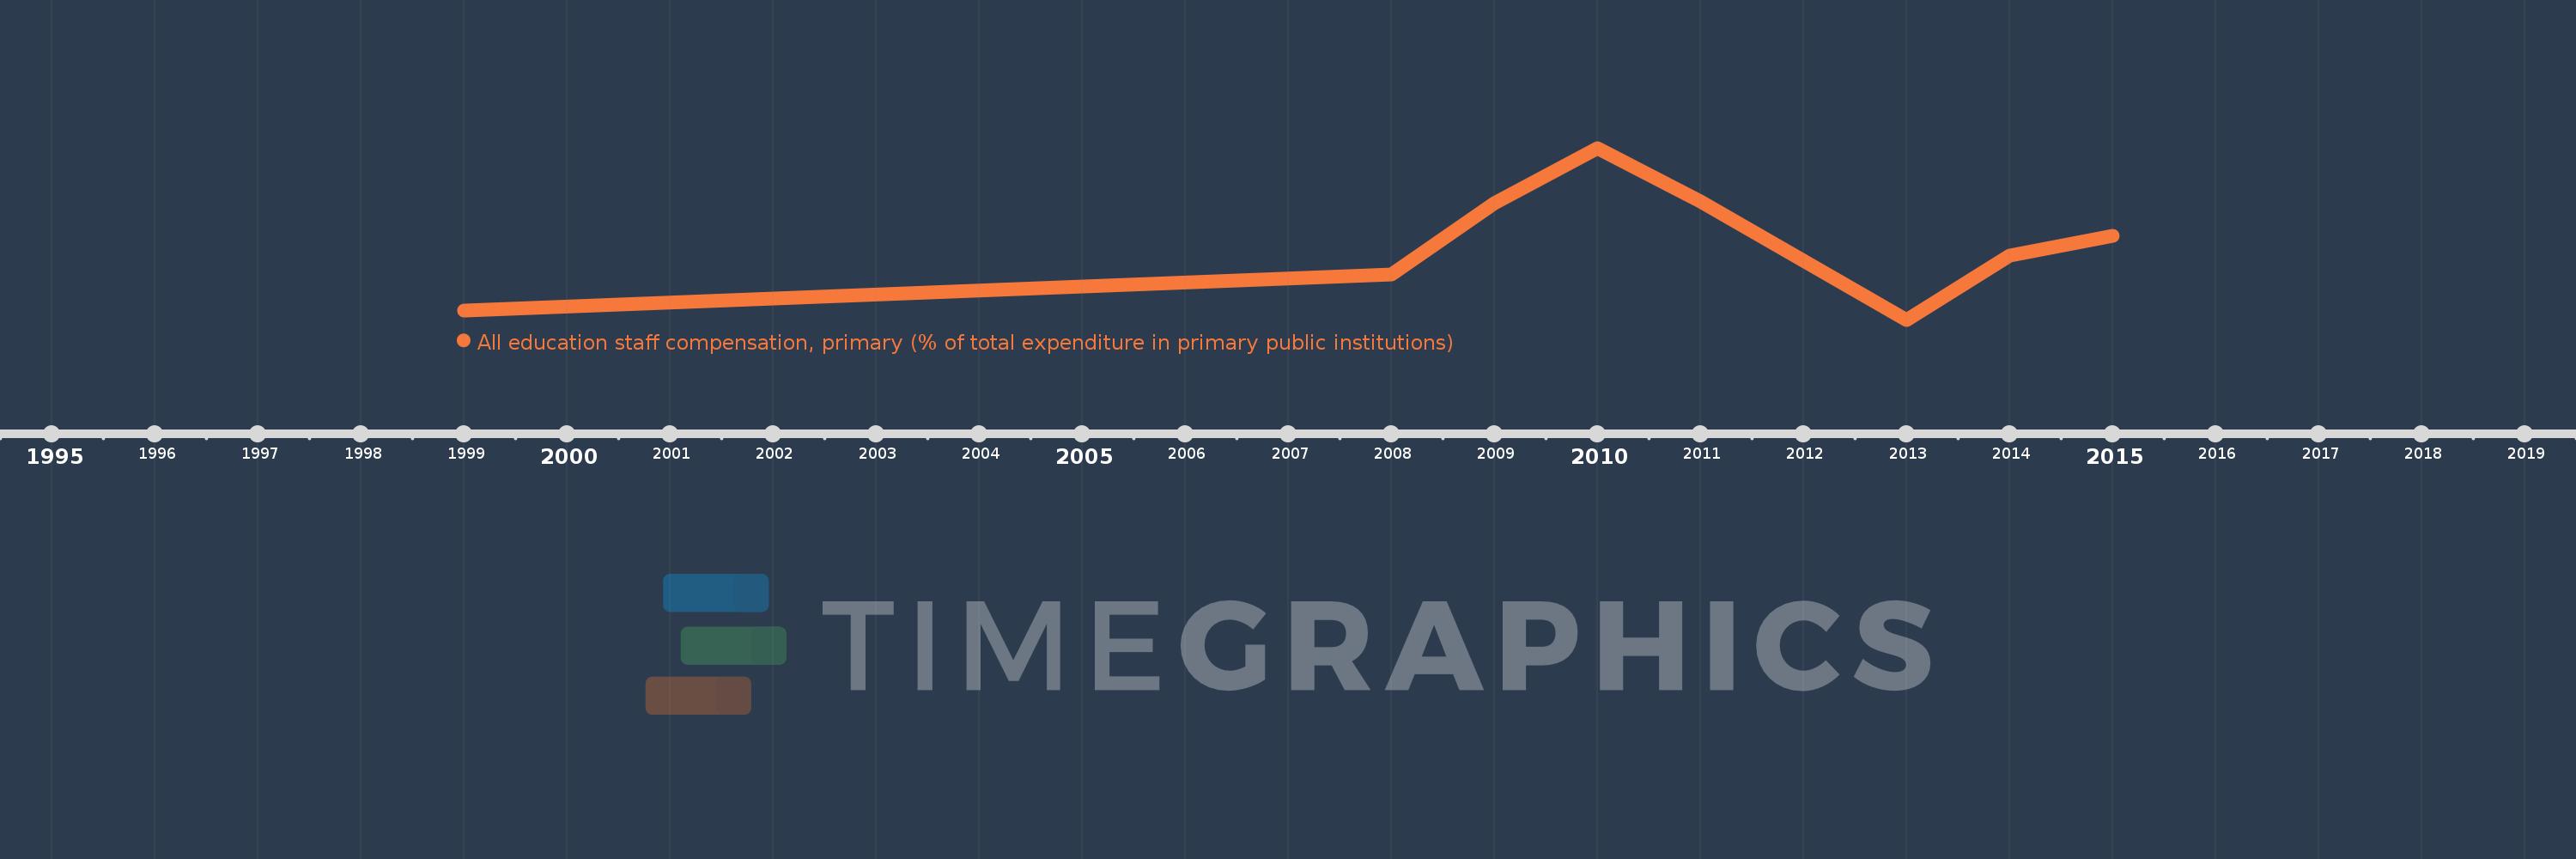
All education staff compensation, primary (% of total expenditure in primary public institutions)
2015,2014,2013,2011,2010,2009,2008,1999
This statistics in other country:
Timeline:
This timeline shows a graph from 1999 to 2015 of Benin. No data until 1998. Number of actual observations by date: 8.
Source name:
World Development Indicators
Source organization:
United Nations Educational, Scientific, and Cultural Organization (UNESCO) Institute for Statistics.
Categories, topics:
Education
Last updated:
apr 23, 2017
Indicators value changes by year
Minimum:
62.705
jan 1, 2013
Maximum:
87.247
jan 1, 2010
At the date of observation
Value
Absolute change
Change from previous value
jan 1, 1999
64.075
+64.075
0.0%
jan 1, 2008
69.201
+5.126
8.0%
jan 1, 2009
79.394
+10.193
14.73%
jan 1, 2010
87.247
+7.852
9.89%
jan 1, 2011
79.648
-7.598
-8.71%
jan 1, 2013
62.705
-16.944
-21.27%
jan 1, 2014
71.851
+9.147
14.59%
jan 1, 2015
74.728
+2.877
4.0%
Ranking of countries by current statistics by years


Comments: