29
/
en
AIzaSyAYiBZKx7MnpbEhh9jyipgxe19OcubqV5w
April 1, 2024
128016
Eritrea
ERI
true
2
1
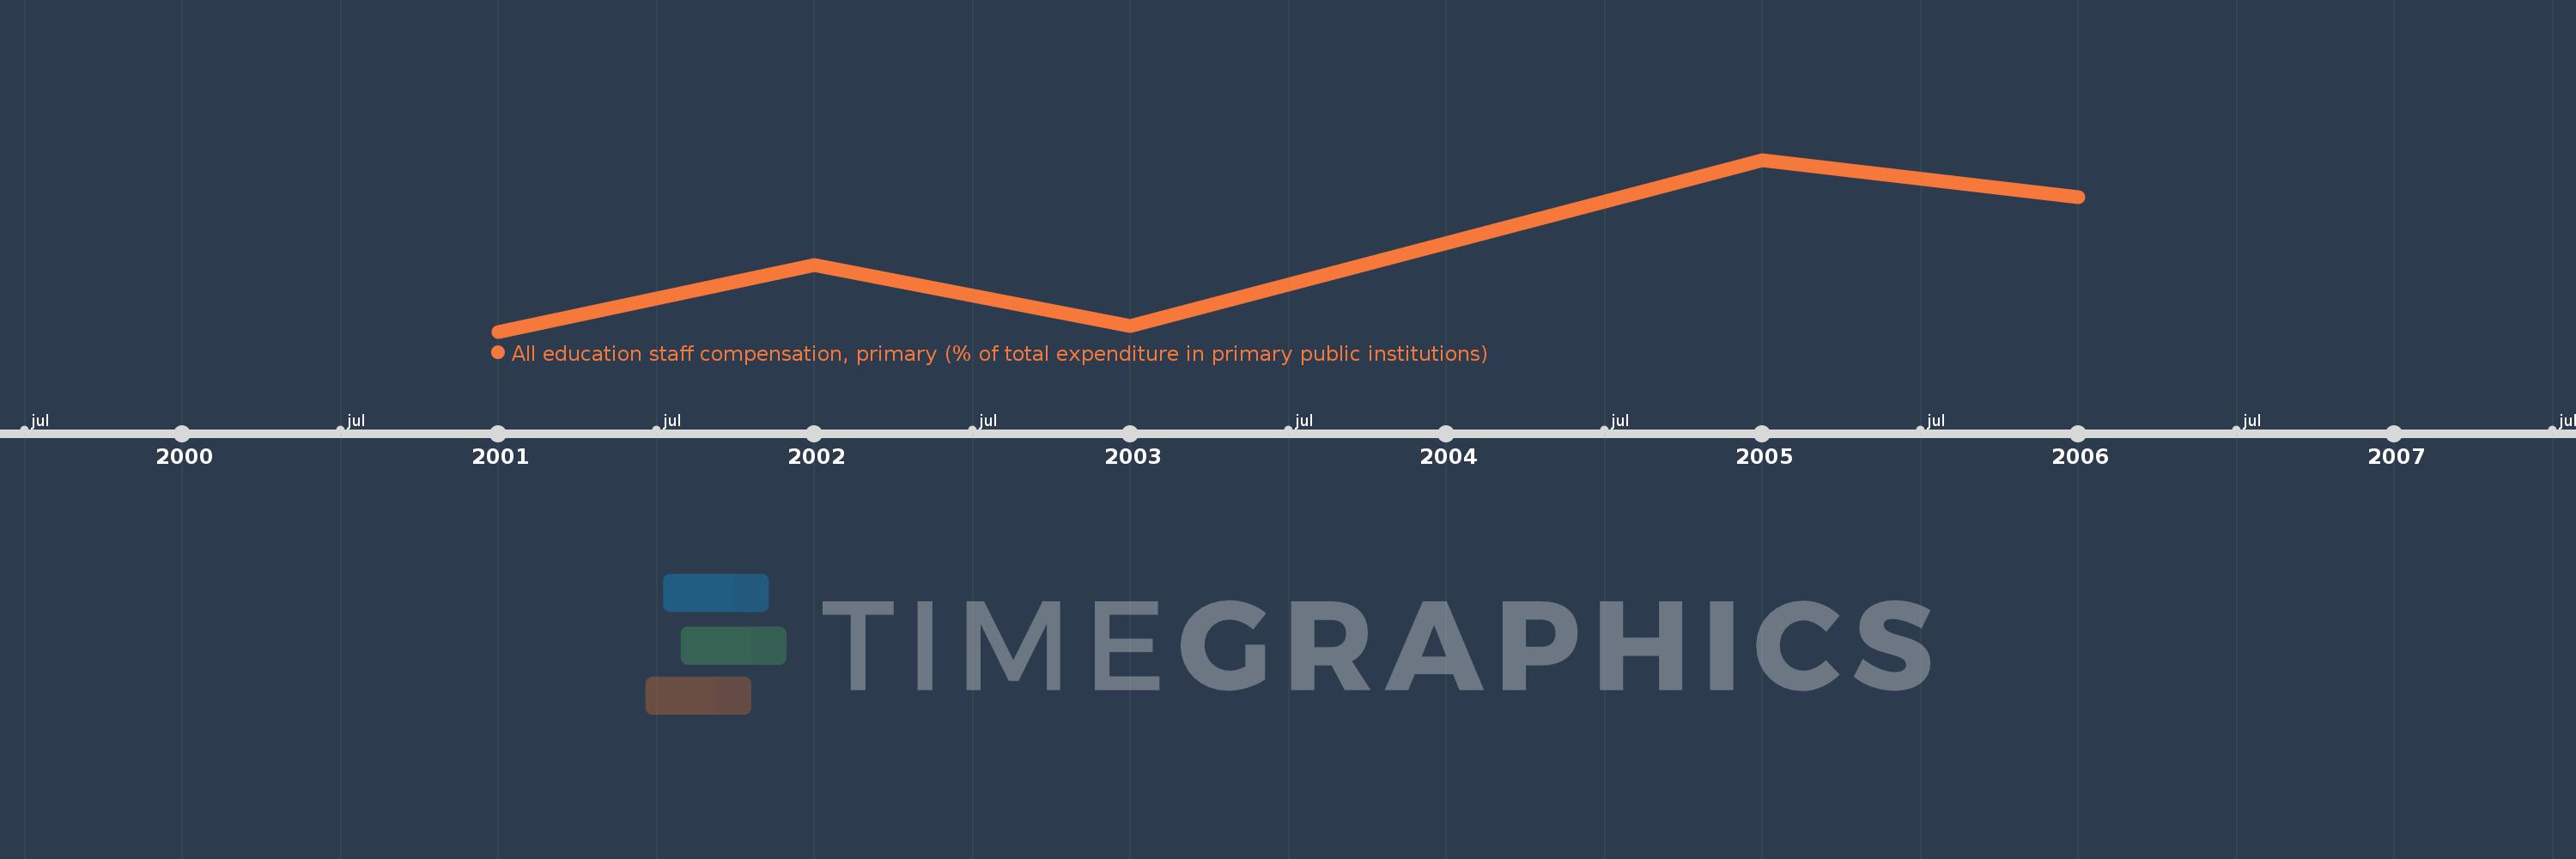
All education staff compensation, primary (% of total expenditure in primary public institutions)
2006,2005,2003,2002,2001
This statistics in other country:
Timeline:
This timeline shows a graph from 2001 to 2006 of Eritrea. No data until 2000. Number of actual observations by date: 5.
Source name:
World Development Indicators
Source organization:
United Nations Educational, Scientific, and Cultural Organization (UNESCO) Institute for Statistics.
Categories, topics:
Education
Last updated:
apr 23, 2017
Indicators value changes by year
Minimum:
72.573
jan 1, 2001
Maximum:
96.203
jan 1, 2005
At the date of observation
Value
Absolute change
Change from previous value
jan 1, 2001
72.573
+72.573
0.0%
jan 1, 2002
81.671
+9.098
12.54%
jan 1, 2003
73.364
-8.307
-10.17%
jan 1, 2005
96.203
+22.839
31.13%
jan 1, 2006
91.055
-5.148
-5.35%
Ranking of countries by current statistics by years


Comments: