29
/
en
AIzaSyAYiBZKx7MnpbEhh9jyipgxe19OcubqV5w
April 1, 2024
54567
Post-demographic dividend
PST
false
2
1
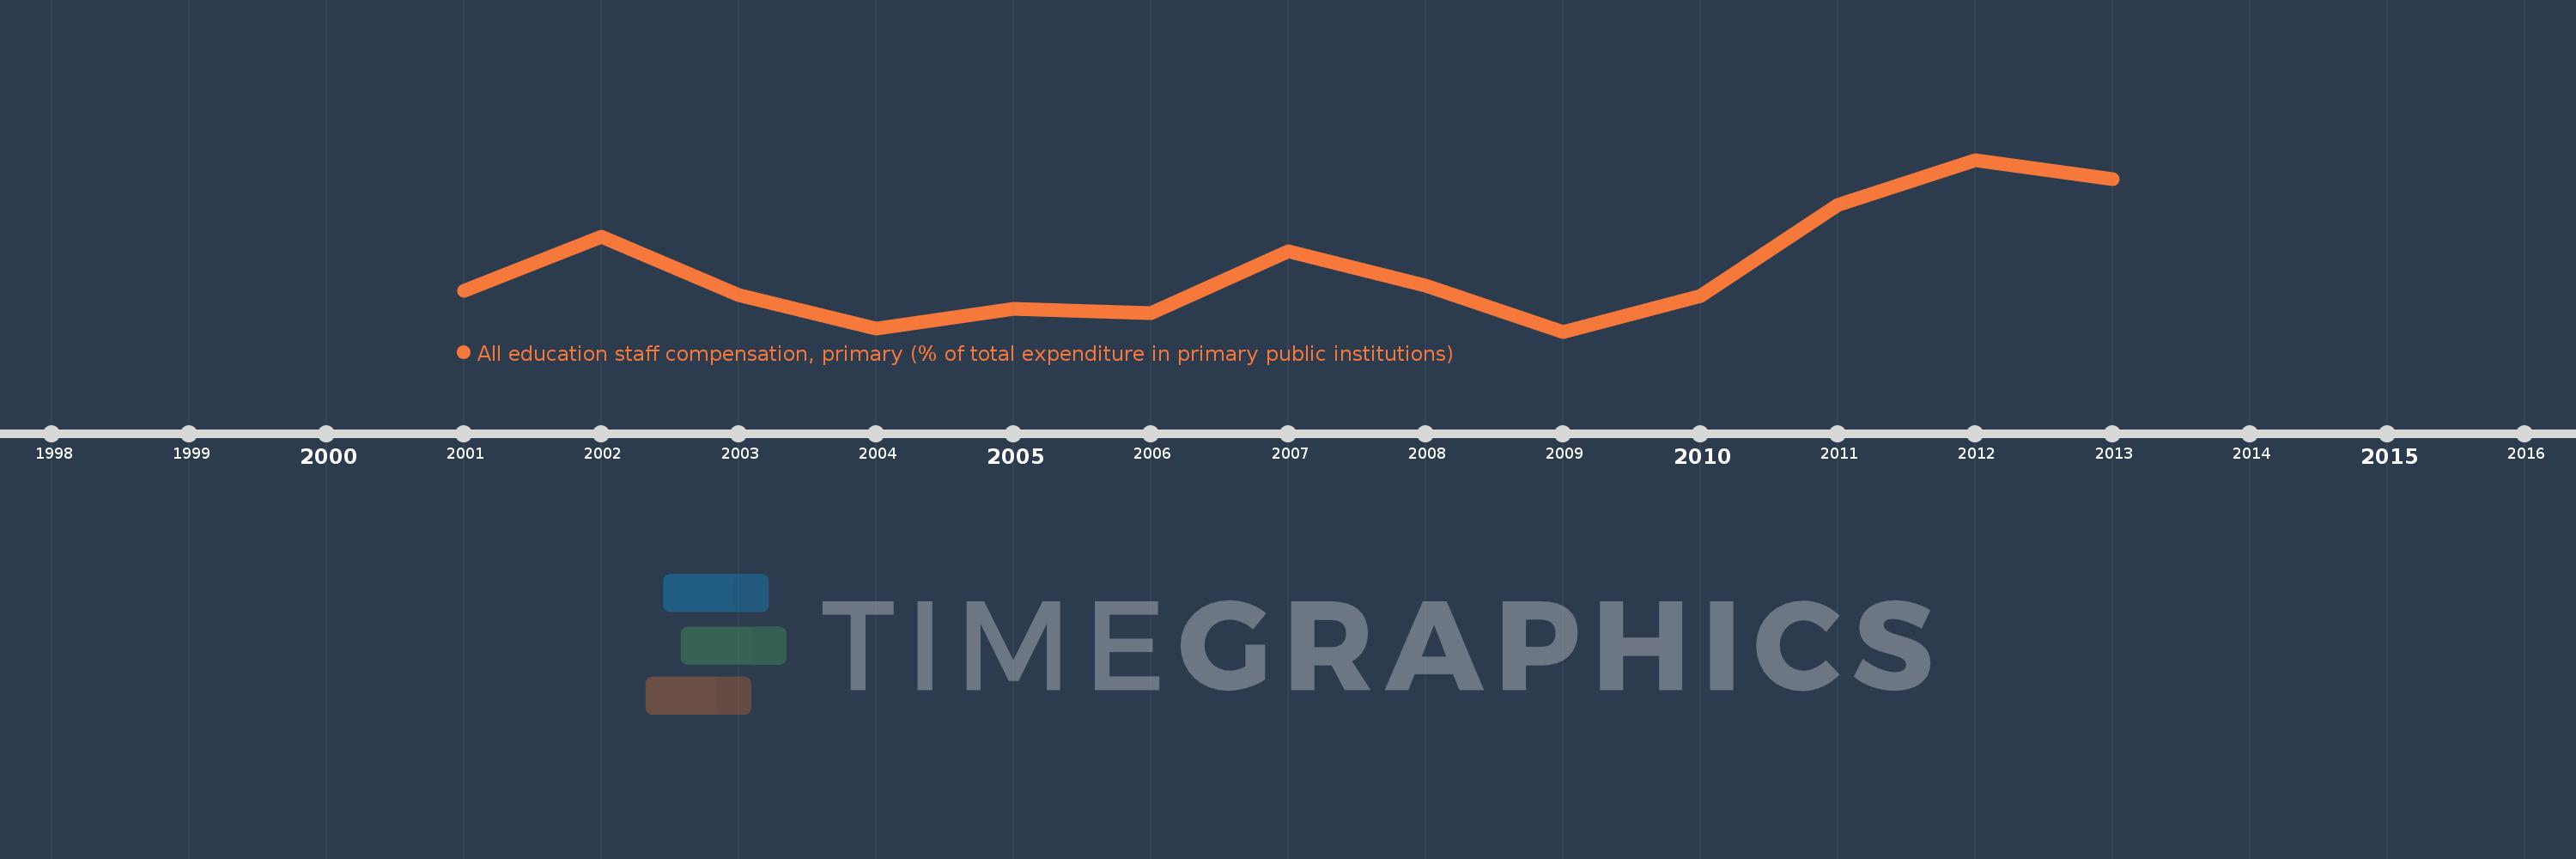
All education staff compensation, primary (% of total expenditure in primary public institutions)
2013,2012,2011,2010,2009,2008,2007,2006,2005,2004,2003,2002,2001
This statistics in other country:
Timeline:
This timeline shows a graph from 2001 to 2013 of Post-demographic dividend. No data until 2000. Number of actual observations by date: 13.
Source name:
World Development Indicators
Source organization:
United Nations Educational, Scientific, and Cultural Organization (UNESCO) Institute for Statistics.
Categories, topics:
Education
Last updated:
apr 23, 2017
Indicators value changes by year
Minimum:
72.009
jan 1, 2009
Maximum:
74.188
jan 1, 2012
At the date of observation
Value
Absolute change
Change from previous value
jan 1, 2001
72.527
+72.527
0.0%
jan 1, 2002
73.213
+0.686
0.95%
jan 1, 2003
72.473
-0.74
-1.01%
jan 1, 2004
72.051
-0.422
-0.58%
jan 1, 2005
72.295
+0.244
0.34%
jan 1, 2006
72.238
-0.057
-0.08%
jan 1, 2007
73.029
+0.79
1.09%
jan 1, 2008
72.588
-0.441
-0.6%
jan 1, 2009
72.009
-0.579
-0.8%
jan 1, 2010
72.466
+0.457
0.64%
jan 1, 2011
73.616
+1.15
1.59%
jan 1, 2012
74.188
+0.571
0.78%
jan 1, 2013
73.943
-0.245
-0.33%
Ranking of countries by current statistics by years


Comments: